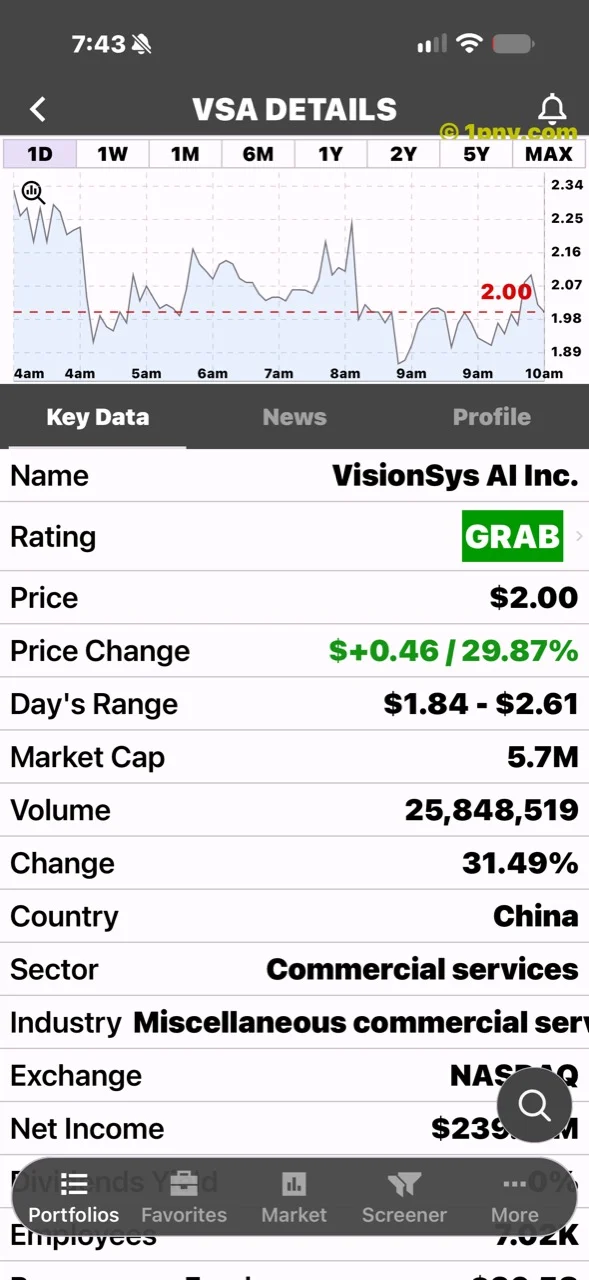
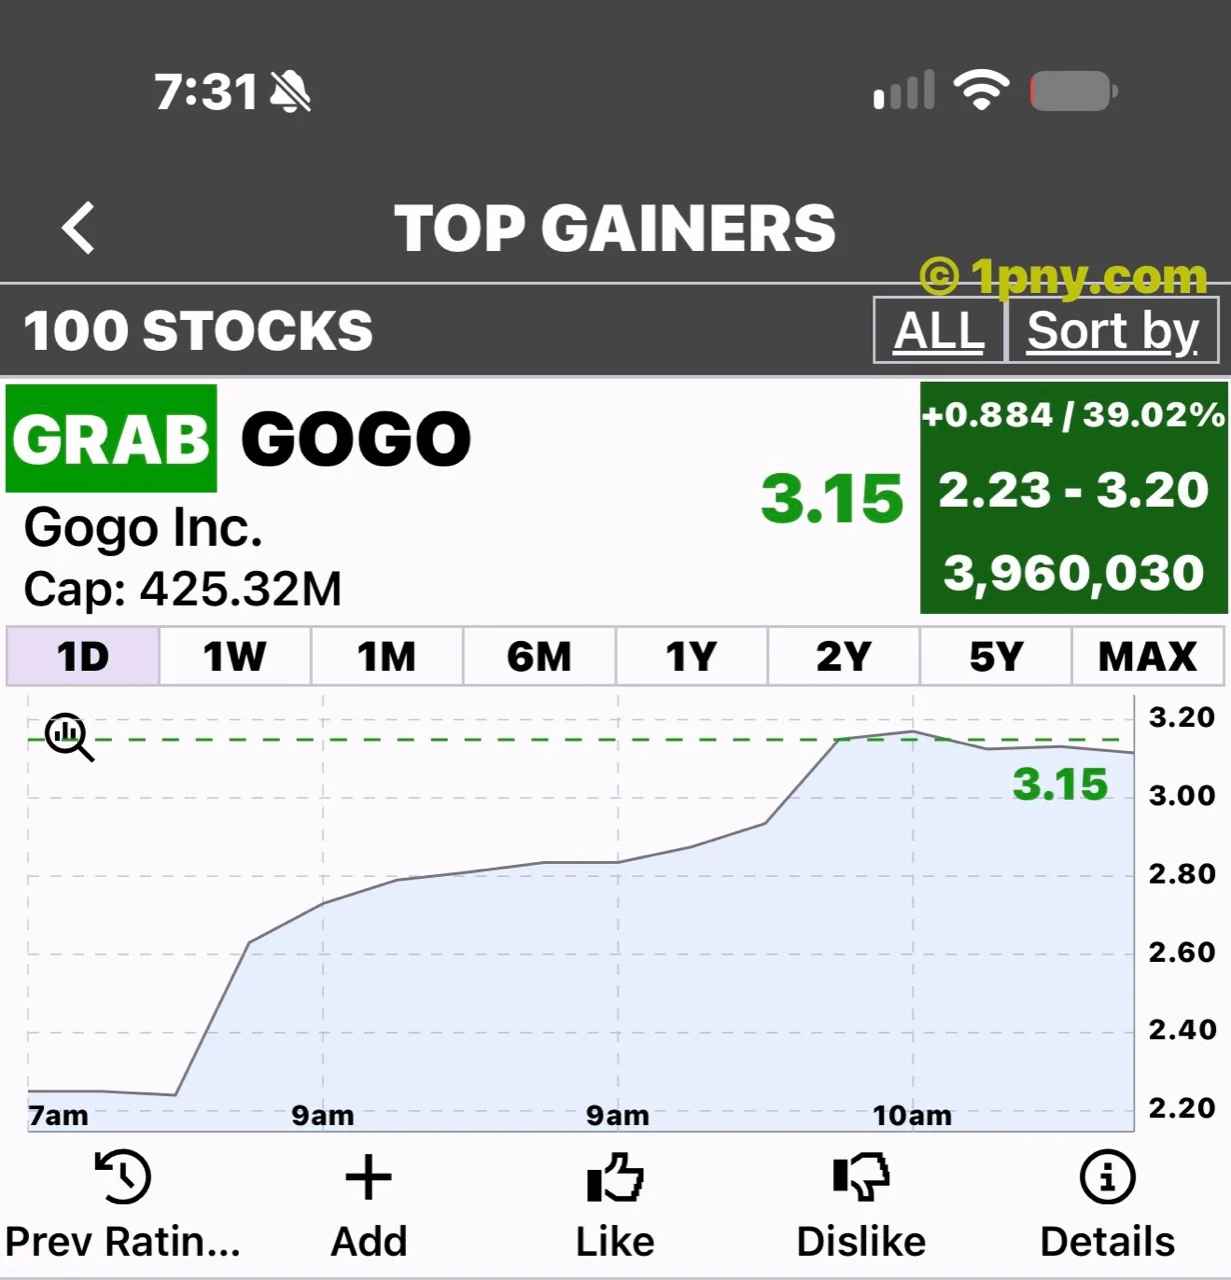
$DNUT, $3.4874. Krispy Kreme (DNUT) rose approximately 30% in the original supplied PennyGems screenshot on November 5, 2026. A higher full-year revenue outlook gave investors a new development to weigh against the company’s continuing turnaround challenges.
DNUT: Krispy Kreme raises its outlook
Krispy Kreme gave investors a sweeter outlook, raising its full-year revenue forecast to $1.35 billion–$1.40 billion from $1.25 billion–$1.35 billion.
The company’s turnaround is still a work in progress: third-quarter revenue declined from the previous year, and it reported a net loss. A higher forecast is encouraging, but it does not mean every problem has disappeared. [Krispy Kreme results](https://www.stocktitan.net/sec-filings/DNUT/8-k-krispy-kreme-inc-reports-material-event-0b7ee12b36fd.html)
The PennyGems snapshot
The approximately 30% move refers to the earlier market screenshot, not a live quote.
Revenue growth and profitability answer different questions
A higher revenue forecast can improve expectations without demonstrating that a company has finished its recovery. Revenue describes sales. Profitability depends on the costs associated with those sales and on other items included in the income statement. A business can raise its sales outlook while still reporting a loss, so both parts of Krispy Kreme’s announcement belong in the same assessment.
The company’s November 5 earnings release also explains that refranchising affected reported revenue. It reported quarterly net revenue of $328.8 million, down 12.4%, while systemwide sales increased 1.0% in constant currency. These are distinct measures: the performance of the wider network should not be confused with revenue consolidated by the company. [Company earnings release](https://investors.krispykreme.com/news-releases/news-release-details/krispy-kreme-reports-third-quarter-2026-financial-results)
That distinction matters when comparing periods during a change in business structure. A transfer of operations to franchise partners can change how activity appears in the company’s accounts. Reading the reported revenue decline alongside the explanation for it gives a more useful picture than interpreting the percentage alone.
Compare the turnaround with cash generation
The release reported an improvement in year-to-date operating cash flow and free cash flow, although free cash flow remained negative. Those developments provide another way to assess progress beyond the revenue forecast. They do not remove the need to examine continuing cash requirements.
For future quarters, a useful comparison keeps the measures consistent. Check reported revenue against reported revenue, systemwide sales against the same network measure, and accounting profit against the corresponding prior-period result. Then consider cash generation separately. Switching between those definitions can make a recovery appear stronger or weaker than a like-for-like comparison supports.
The same discipline applies to market expectations. A sharp share-price response may reflect a change in what traders expected beforehand. It does not independently establish the company’s future earnings, the eventual success of its turnaround or an appropriate valuation for the shares.
What investors should watch
The higher revenue forecast sets a new benchmark for future results. Investors should watch whether revenue performance improves and whether losses narrow. A revenue outlook describes expected sales; it is not a promise of profitability or a guarantee that the turnaround will succeed.
News may help explain interest in a stock, but it cannot establish exactly why every trader bought or sold. A large percentage gain does not tell the whole story, and volatile stocks can reverse quickly.
*Price movements are from the supplied PennyGems screenshot and are not live quotes or a recommendation to buy or sell.*