$JRVR, $3.82. According to PennyGems App stock analysis james River presents a different kind of investment question from a conventional growth company. The appeal is the possibility that an insurer can earn dependable underwriting profits and restore confidence in the value of its capital. The challenge is that an insurer’s reported equity depends heavily on estimates of claims that may not be settled for years.
That makes JRVR a potential recovery investment requiring particular care. A low quotation can create opportunity, but it can also represent the market’s judgment that the balance sheet deserves a substantial discount. A trustworthy bullish case has to explain why that judgment might become too pessimistic.
Underwriting provides a reason to investigate
James River’s August 10 second-quarter release reported a 92.8% combined ratio in its excess-and-surplus lines business and tangible common equity of US$9.01 per share at June 30. Adjusted operating income was US$10.0 million, lower than the prior-year quarter. Tangible common equity and adjusted operating income are non-GAAP measures. [1]
A combined ratio below 100% ordinarily indicates an underwriting profit before investment income, using the components and exclusions in the insurer’s definition. That is encouraging because an insurer should be able to price risk appropriately rather than depend on investment returns to compensate indefinitely for poor underwriting.
The analytical question is whether that underwriting performance can persist after claims mature. It is also important to evaluate the relevant segment rather than assuming that a favorable ratio automatically describes every part of the group. Falling adjusted income is a reminder that one encouraging metric does not settle the overall earnings question.
What the supplied JRVR chart actually shows
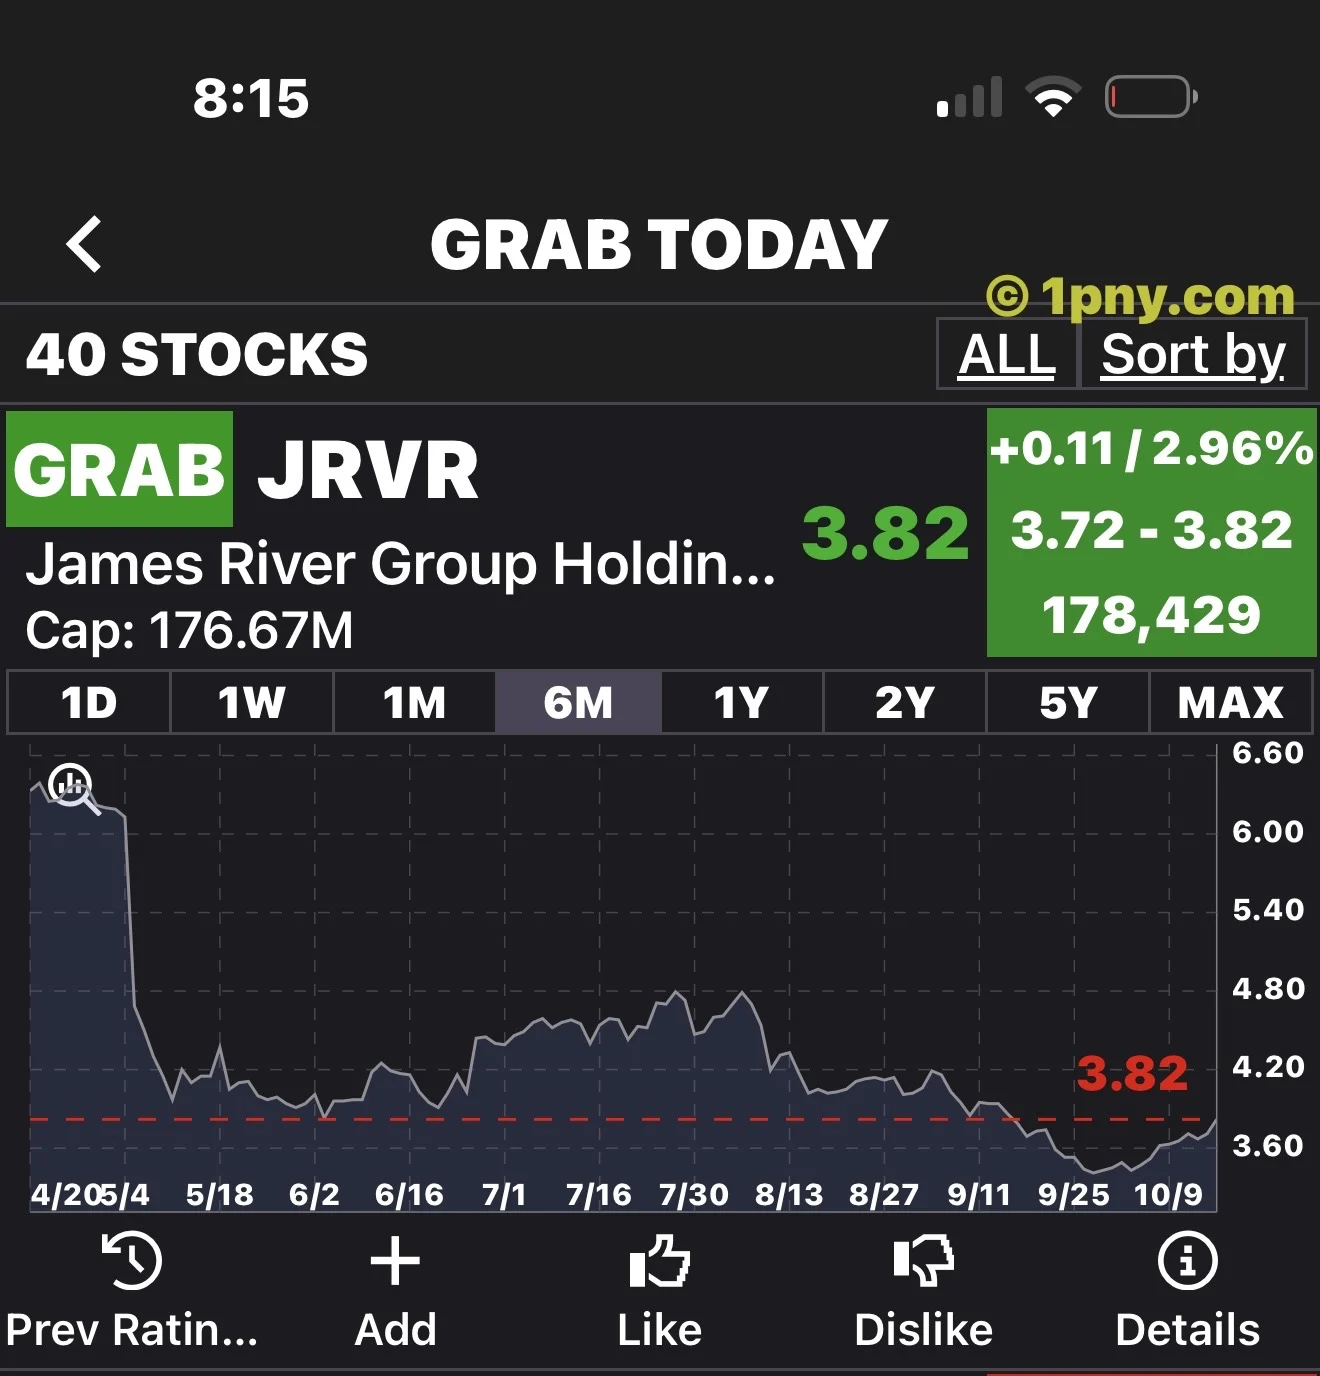
The PennyGems screenshot supplied by the reader displays JRVR at 3.82 with the six-month view selected. Its visible path includes a steep earlier fall and a later period at lower levels. The image provides context for why a recovery thesis might interest readers; it does not establish the cause of the fall or prove that the shares are cheap.
The capture date and currency are not fully identified. We therefore do not present the displayed quote as a current executable price or calculate a live price-to-book ratio from it. The app’s GRAB label belongs to the app. Our analysis instead asks what evidence would justify confidence in the insurer’s future earnings and reported capital.
A previous trading level is not an estimate of fair value. Readers should be especially wary of assuming that a share must recover simply because a chart shows where it once traded.
Reserve protection deserves close attention
The earnings release said James River used the remaining US$7.5 million of aggregate protection under its E&S Top Up adverse-development reinsurance contract. [1] That specific limit being exhausted does not mean all of the company’s reinsurance has disappeared. It does mean investors should examine the remaining protection rather than assume the same contract can absorb additional development indefinitely.
Insurance reserves are estimates of future claim costs. If those estimates later prove inadequate, extra charges can reduce both earnings and equity. Reinsurance can transfer some exposure, but the scope, limits and collectability of the protection matter. James River’s annual filing provides fuller context on its reserve estimates, reinsurance arrangements and capital structure. [2]
Our practical test would be to ask how much unfavorable development an investment thesis could withstand. A valuation that only works if every estimate proves accurate offers little room for uncertainty. Conversely, credible evidence that newer underwriting is more resilient could gradually improve confidence.
Tangible equity is not a promised payout
A reported per-share equity measure is a starting point for analysis, not money a shareholder can demand from the company. Insurance capital supports policyholder obligations, and the value available to common owners is affected by claims estimates, other capital claims and potential dilution. The annual filing discusses the preferred-share arrangements as well as the broader financial risks. [2]
An investor should use a consistent definition of equity and an appropriate share count. Mixing a common-share price with a different capital measure can create an attractive-looking discount that does not represent the economics actually available to that shareholder.
What would strengthen the recovery case
The evidence to seek is sustained underwriting profitability, stable reserve development and capital retained after the company’s obligations. A cleaner earnings record could matter more than a single strong quarterly result. New reserve surprises, shrinking sustainable earnings or dilution without corresponding value creation would weaken the case.
JRVR may interest investors willing to study an insurer’s balance sheet and tolerate a recovery that could take time. The thesis is conditional on the quality of reported capital and future underwriting. It is a speculative opportunity to investigate, not a guaranteed return to the share price shown earlier in the supplied chart.
About PennyGems, the app behind these screenshots
The stock-chart screenshots in this article were provided from PennyGems, a mobile stock-research app available for iPhone on the App Store and for Android on Google Play. The accompanying image shows its iPhone App Store listing. [4][5]
For readers researching penny stocks trading under $5, PennyGems offers a way to build a shortlist within a broader universe of low-priced shares. Its iPhone listing advertises coverage of over 2,000 stocks under $10. The app updates its buy and sell recommendations daily, with its listings describing updates three times a day. [4][5]
PennyGems helps users spot trending stocks that its system rates as buy candidates, compare opportunities across sectors and industries, and flag penny stocks carrying Sell or Dump ratings for closer scrutiny or avoidance. Charts, watchlists, fundamentals and rating history give readers additional context for investigating those signals. The app’s rankings are research inputs, rather than a guarantee of which stocks or industries will perform best. [4][5]
Get PennyGems for iPhone through the App Store link [4], or for Android through the Google Play link [5] below.