
PEPG stands out in the supplied Penny Gems charts with a gain of about 114%. PepGen’s November 10 clinical update provides concrete news to examine, while the size of the stock move should not be confused with the strength or certainty of the medical evidence.
The charts capture a sharp repricing
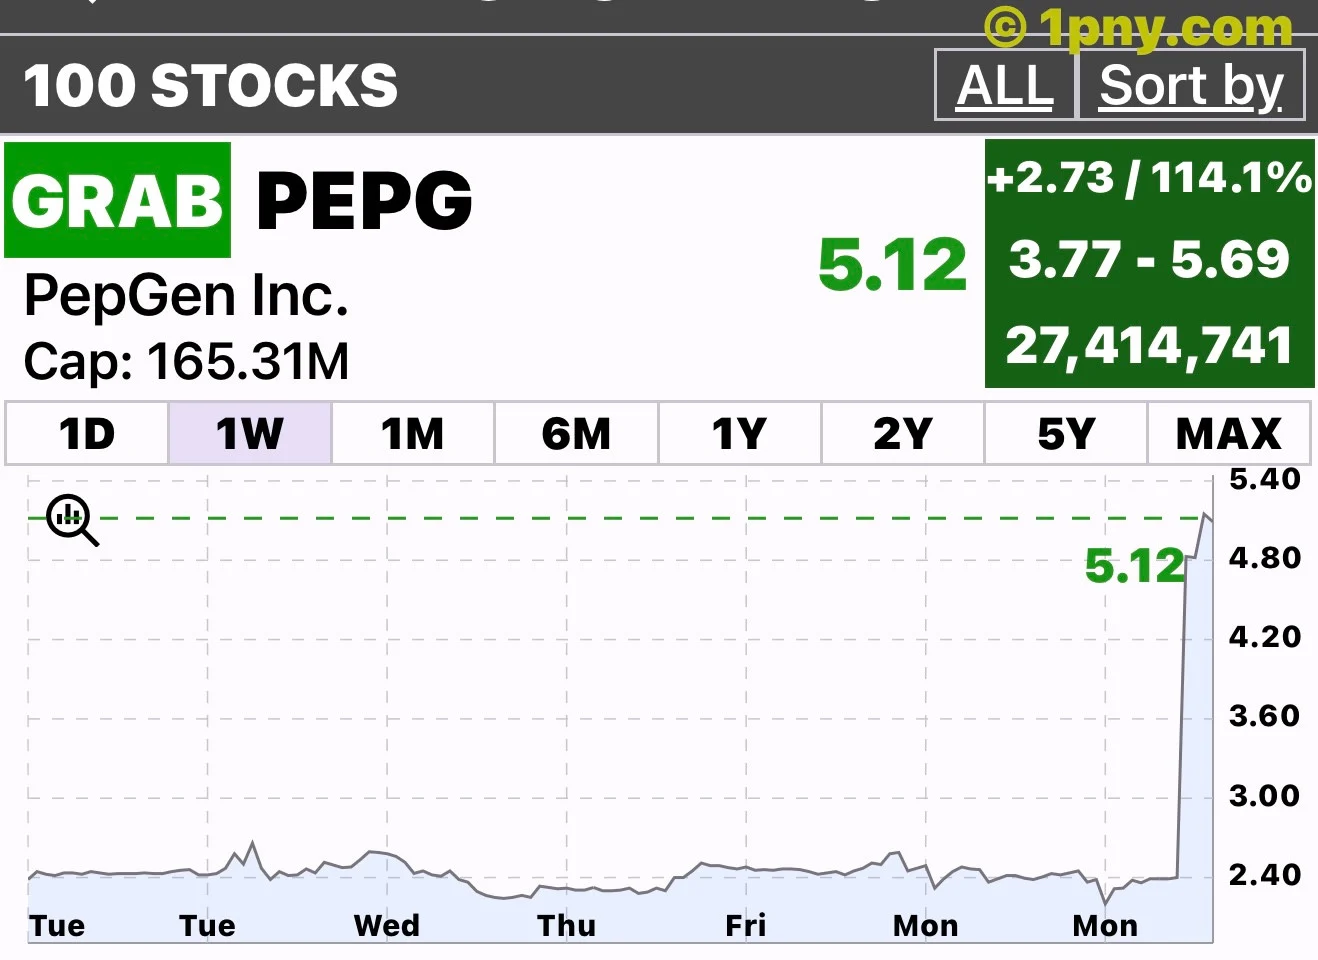
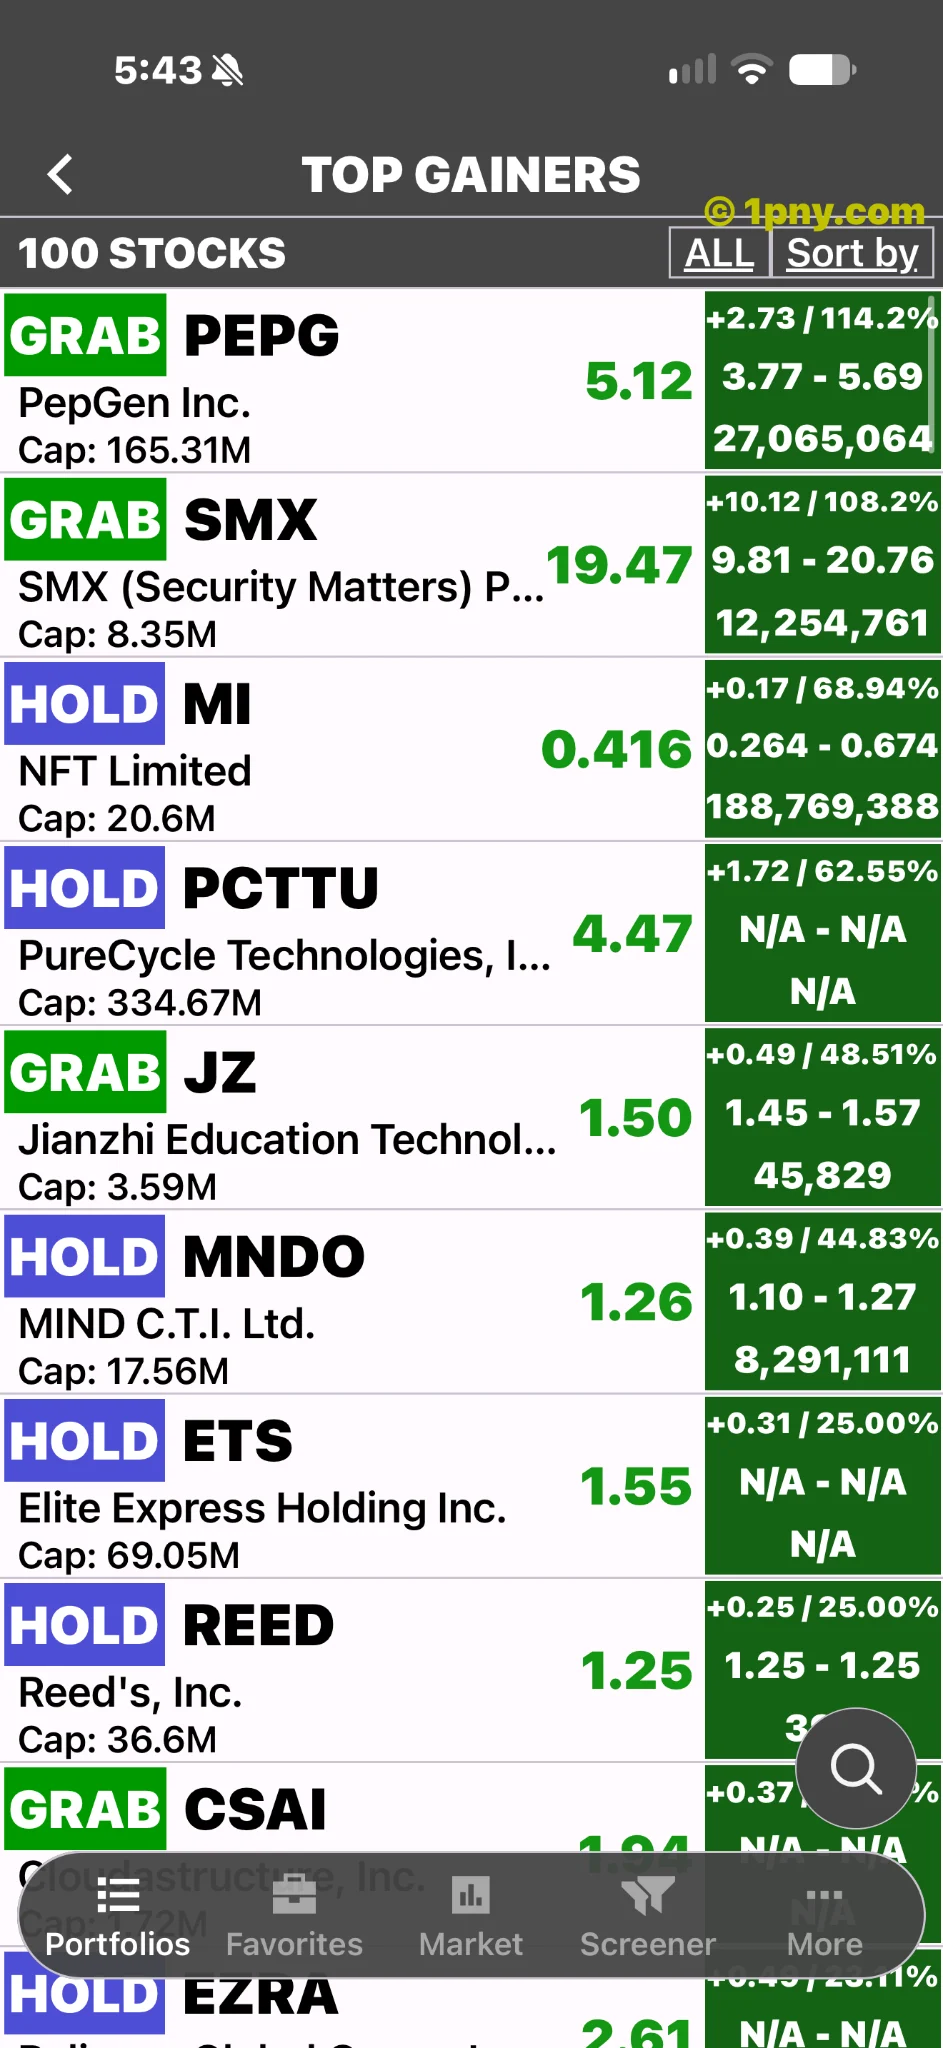
The supplied weekly chart shows $5.12, a +114.10% gain and 27.41 million shares traded. Its displayed range is $3.77 to $5.69. The line moves abruptly higher after spending much of the visible week around the mid-$2 area.
A separate intraday details screen shows $5.11 and 113.80%. These are different app readings, not interchangeable quotes. The initial gainers list showed 114.20%. The screenshots do not provide a complete capture date and time zone, so these figures are attributed snapshots rather than a verified closing result.
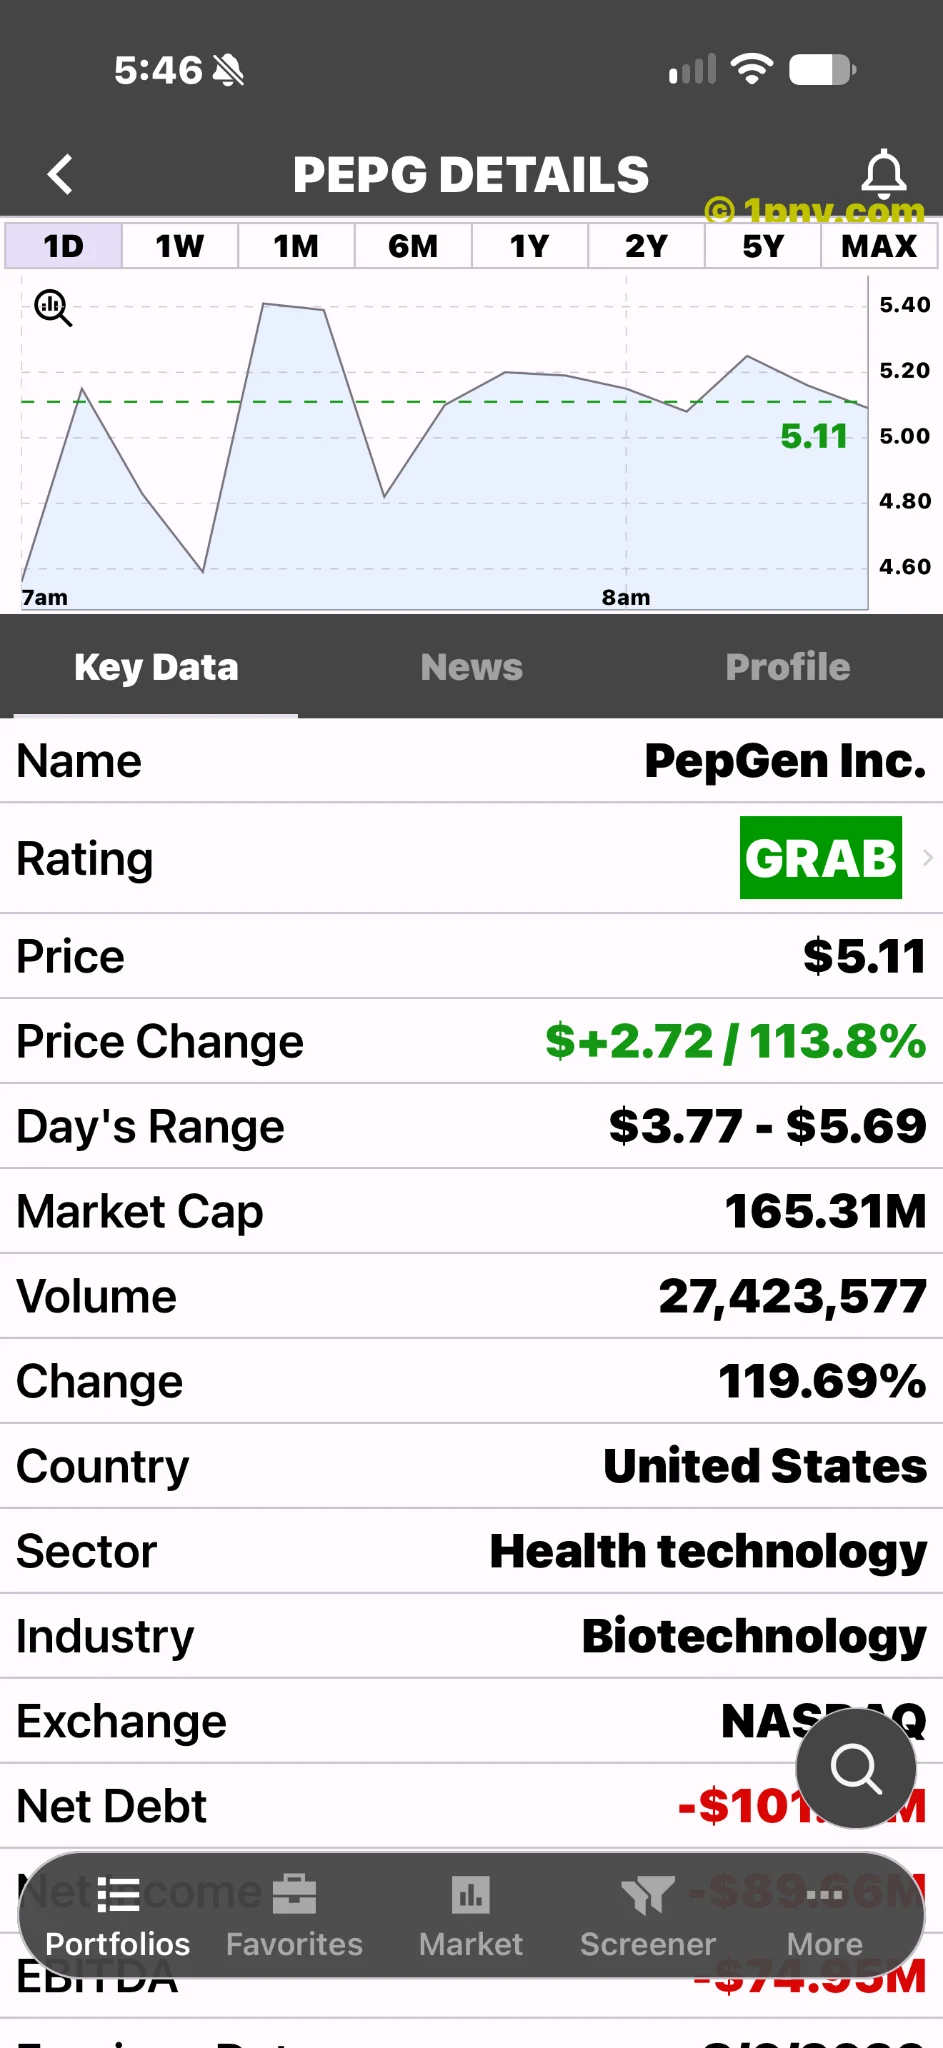
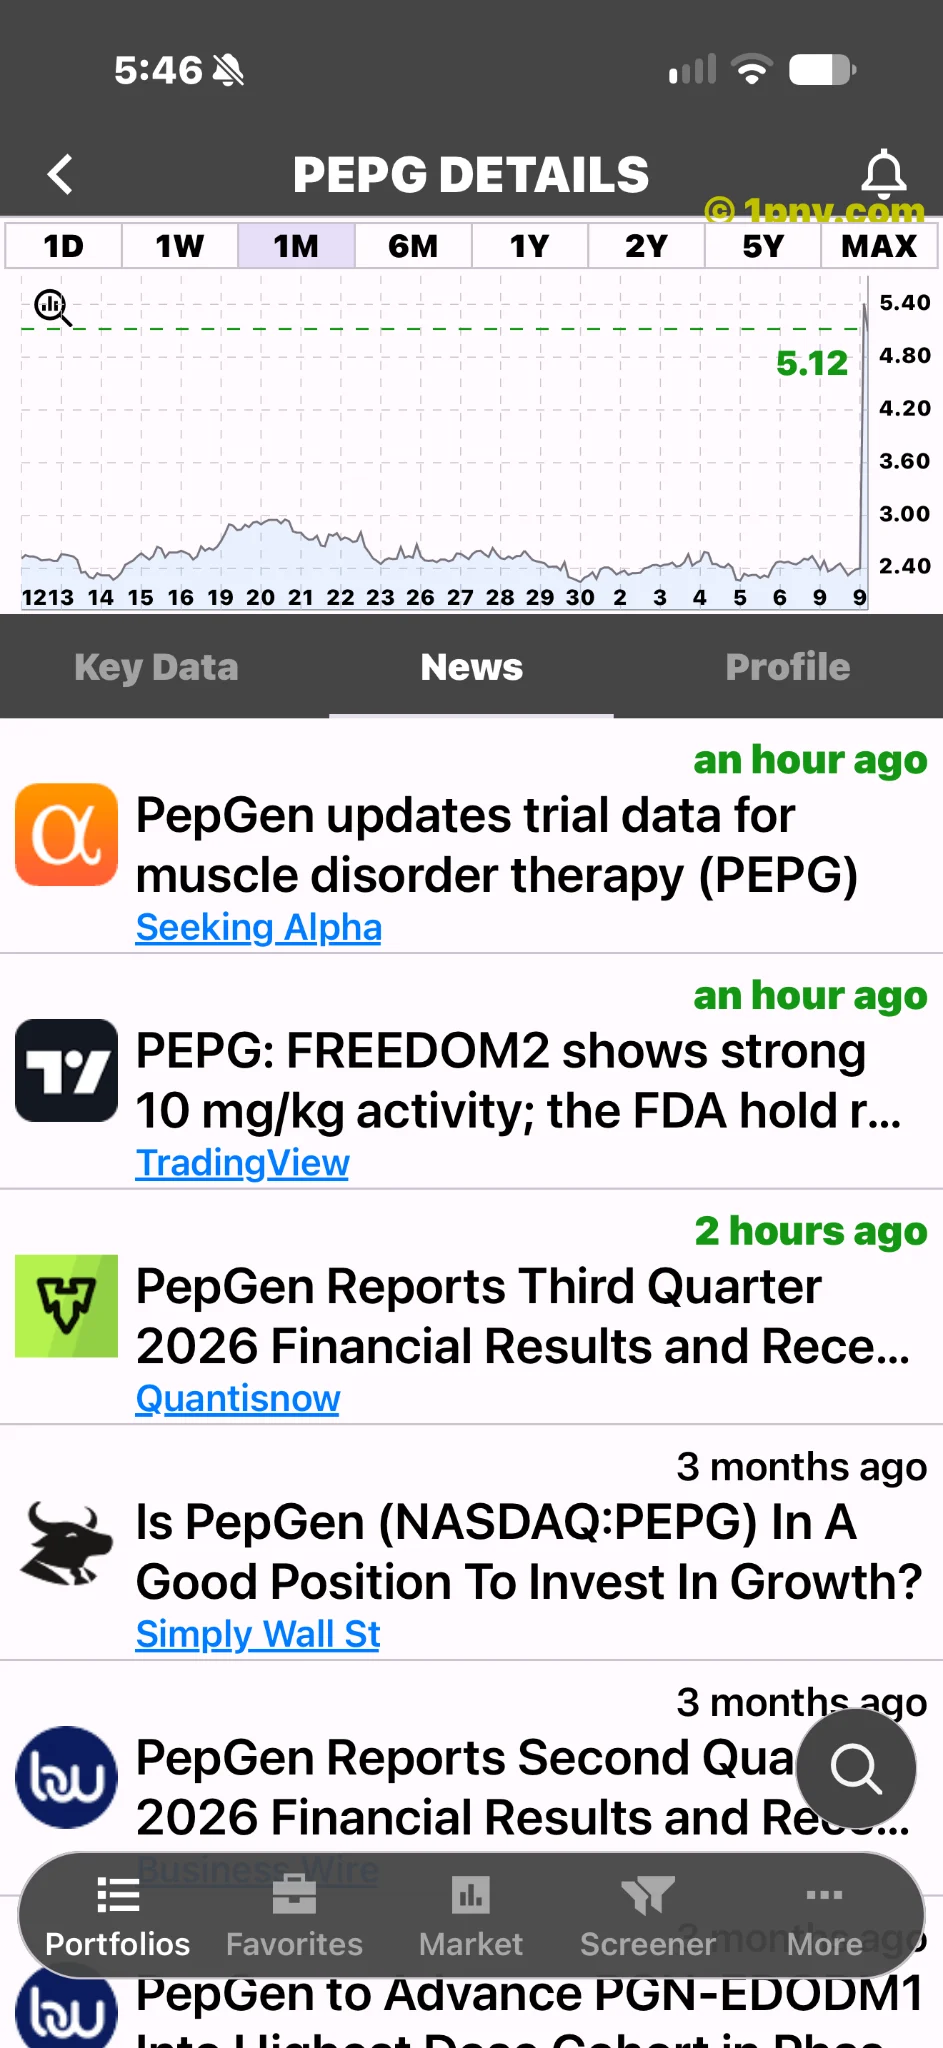
The one-month view also ends with a sharp jump, while the six-month view provides earlier trading context. A chart can show that expectations changed quickly. It cannot establish that a medicine works, explain every buyer’s motive or show whether a higher share price will last.
What the new clinical results show
In its November 10 trial release, PepGen reported 46.50% mean RNA splicing correction for experimental DM1 treatment PGN-EDODM1, versus 6.80% in pooled placebo participants. DM1 is myotonic dystrophy type 1. The 10 mg/kg cohort had six treated participants and two on placebo. Patient-reported outcomes were inconclusive; four mild renal adverse events occurred.
Those results deserve attention, but the small sample is central to interpreting them. A molecular measurement and a patient’s everyday experience answer related but different questions. Larger studies and longer observation are needed to judge how consistently an early signal translates into meaningful benefit.
Readers should also resist comparing headline percentages from unrelated studies without checking populations, measurement methods and follow-up periods. An impressive-looking number is not automatically evidence of superiority over another treatment.
The U.S. hold remains a separate hurdle
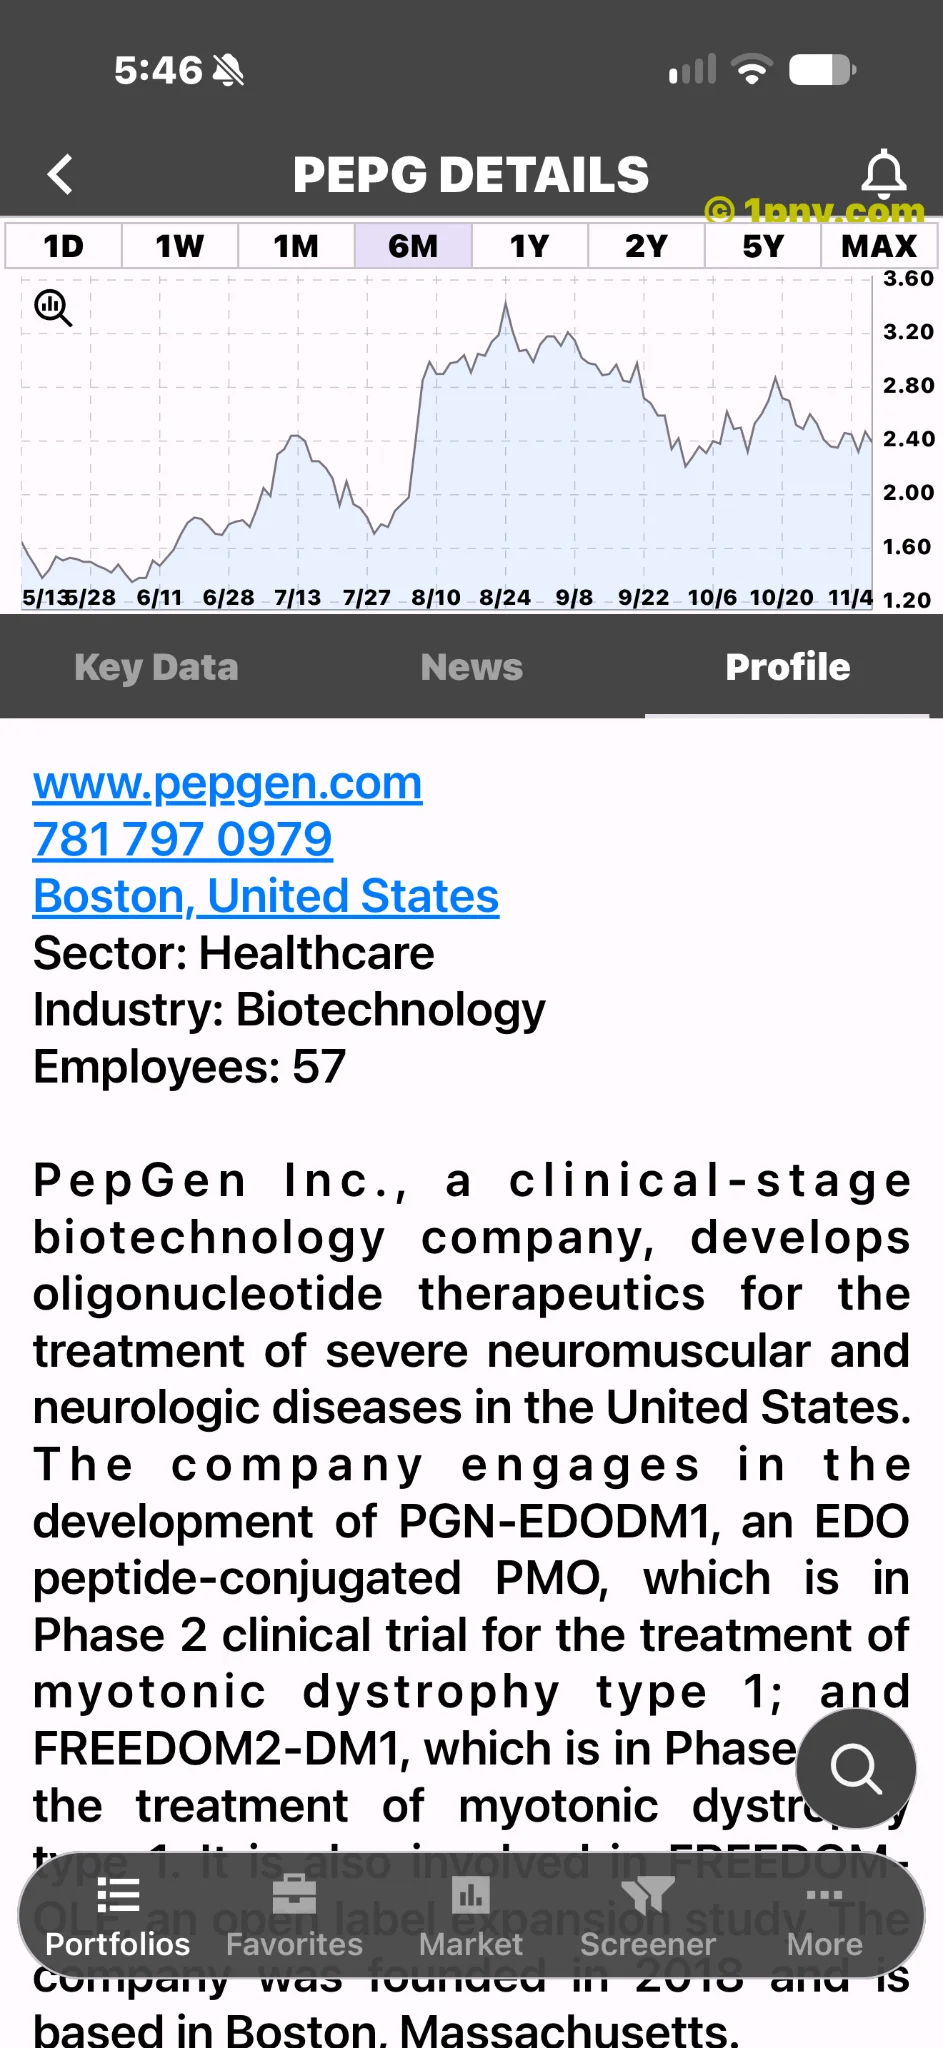
PepGen’s quarterly update says the U.S. partial clinical hold remains active. Results from the 12.5 mg/kg cohort are expected in the first half of 2027. Cash, equivalents and marketable securities totaled $104.80 million at September 30; management forecasts funding into 2028.
A cash-runway forecast is an estimate, not a guarantee that no additional financing will be needed. Development costs, timing and regulatory requirements can change. Likewise, a positive overseas readout should not be described as removal of the U.S. restriction.
What would make the story stronger
The next useful evidence is further clinical follow-up, clearer patient benefit, safety data and regulatory progress. Those developments would address the business questions behind the chart more directly than another large daily percentage move.
Volume counts shares traded, not unique buyers. The same share may change hands repeatedly. Without reliable positioning data, the screenshots alone do not establish institutional accumulation or a short squeeze.
This is market reporting, not a recommendation to buy or sell. GRAB is the app’s label, not this article’s advice.