
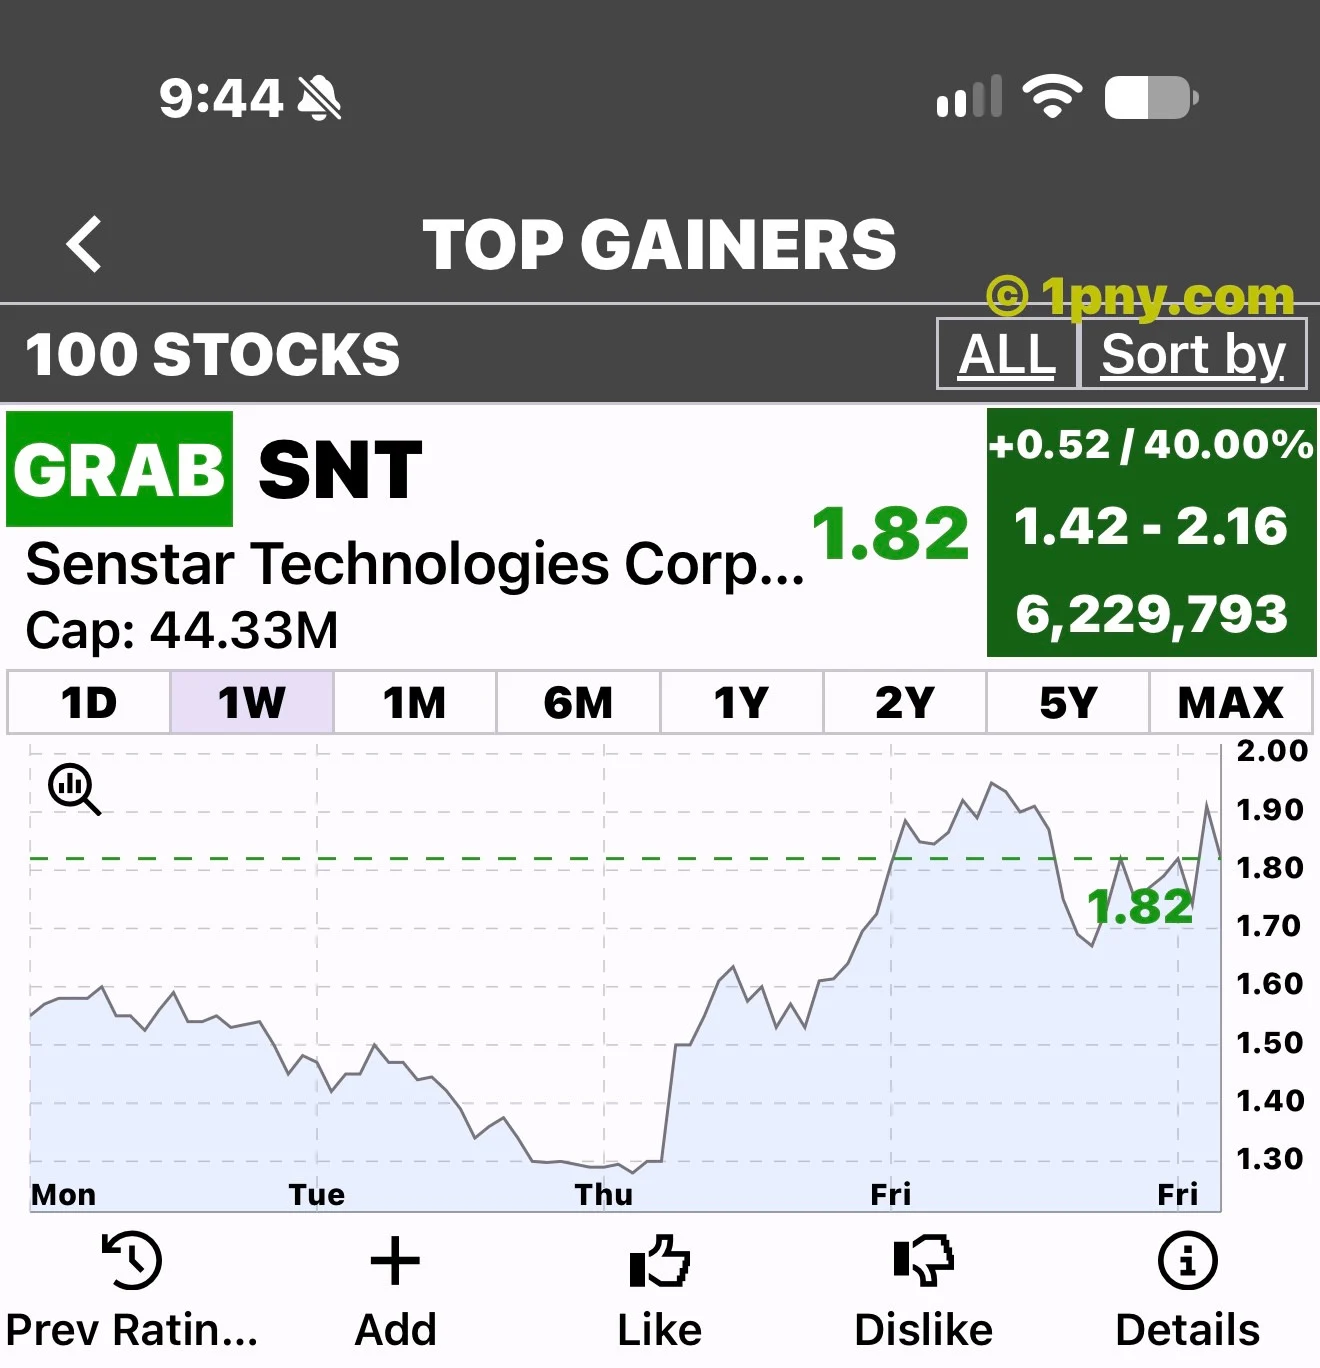
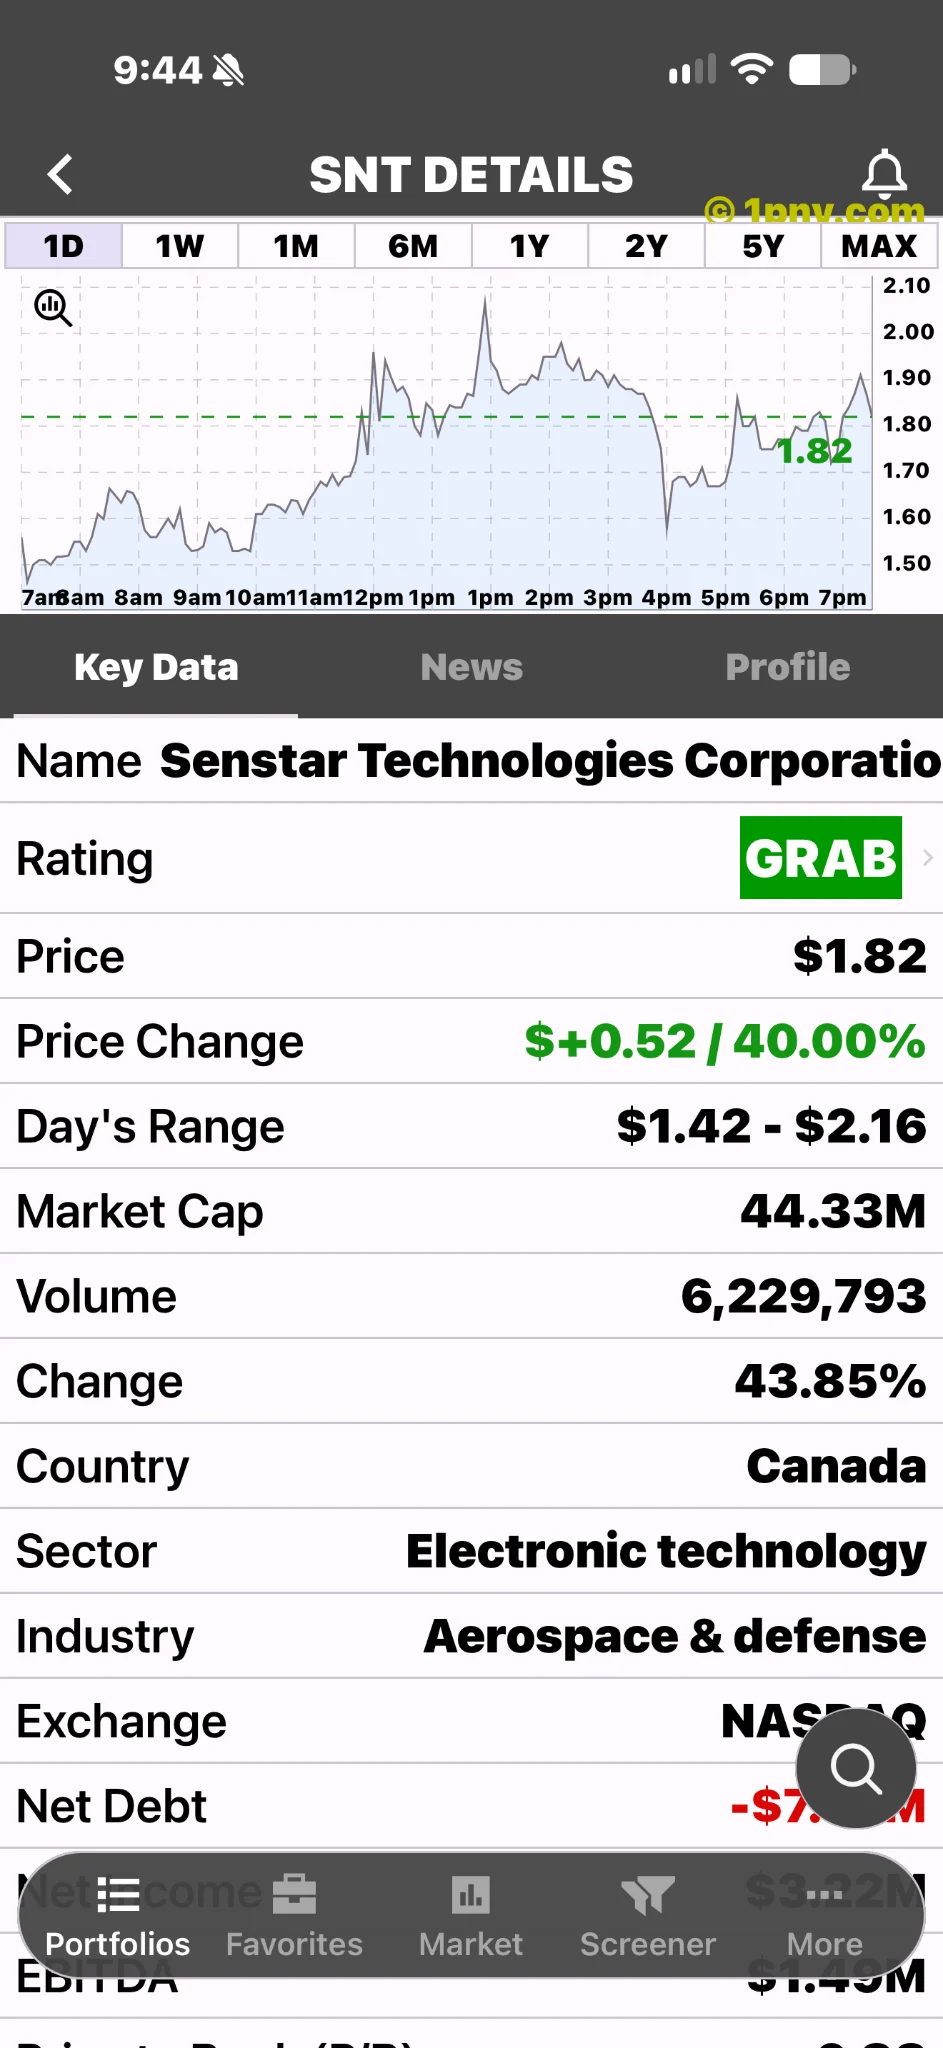
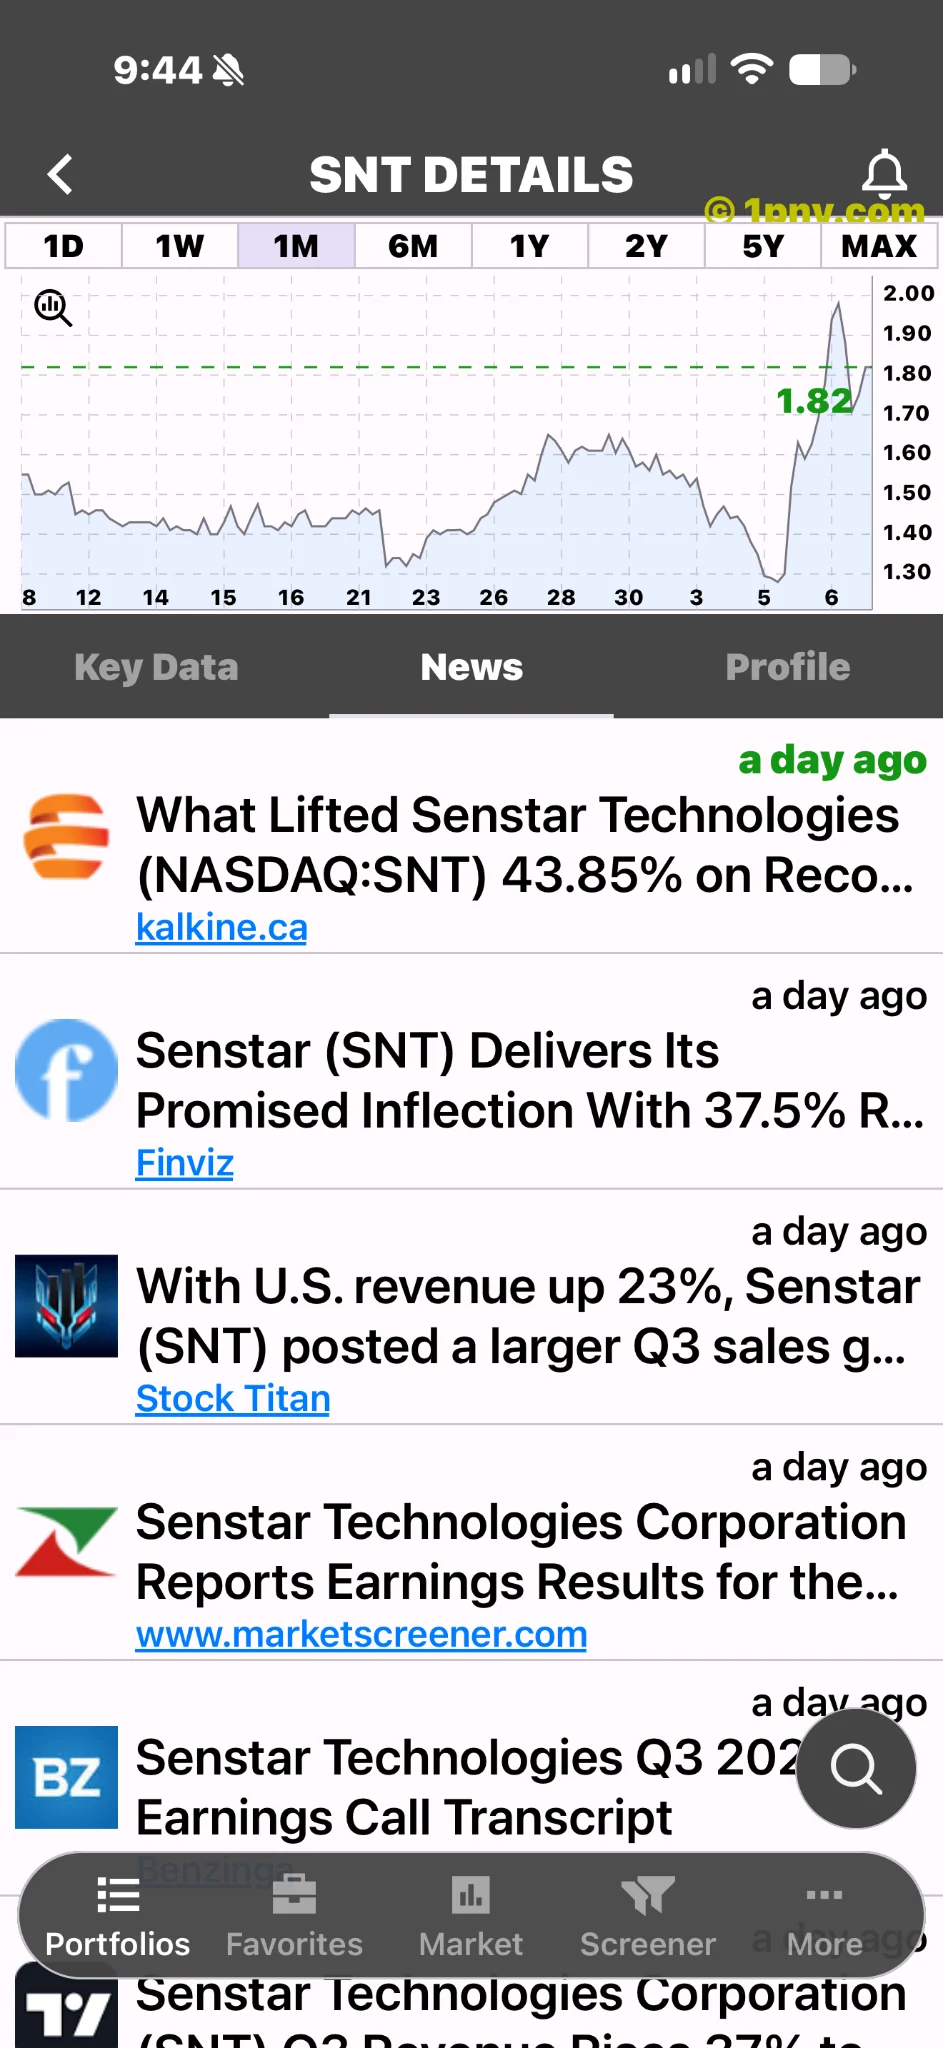
Senstar Technologies’ November 6 earnings release gave investors a concrete operating development to assess: stronger sales accompanied by higher profit. The stock closed at $1.90, up +46.15%, according to historical market data. The supplied Penny Gems image shows a different snapshot, $1.82 and a +40% gain, and should not be read as the regular-session closing result.
What changed in the business
Senstar reported third-quarter revenue of $13.1 million, up +37%, and net income of $1.5 million. LiDAR sales more than doubled. Gross margin was 66.3%, down from 67.3%. The company reported $8.4 million in cash and short-term deposits and no debt. It also cautioned that purchase accounting for its Blickfeld acquisition remained preliminary.
The timing makes the earnings announcement a clear company-specific backdrop for the rally. It offers more substance than an unexplained price surge, but does not prove the motives behind every trade. Investors still have to decide how representative the quarter is and what expectations the new share price already incorporates.
Why profitable growth matters
Revenue growth indicates that a company is selling more in dollar terms. Profit adds a second question: how much remains after the costs recognized during the period? Looking at both helps distinguish expanding business activity from expansion that consumes all of its additional sales through higher expenses.
This is especially useful when evaluating a company with an appealing technology story. A growing market can attract attention without guaranteeing attractive economics for each supplier. Evidence of earnings provides another reference point, although one quarter cannot establish the strength of an entire business cycle.
The logical next step is to examine consistency. Investors can compare successive periods and ask whether customer demand, product mix and expenses are moving in a direction that supports repeatable results. A single strong quarter should be treated as evidence to investigate, not as a promise about the next one.
Margins deserve their own reading
A company can generate more gross profit dollars while earning less gross profit per dollar of sales. That distinction explains why revenue growth and margin trends should be reviewed separately. Neither metric alone supplies a complete picture of operating quality.
Acquisitions also complicate comparisons. When the scope of a business changes, investors should ask which activities contributed to growth and how the acquired operations affect expenses. This is a general analytical question, not a calculation of Senstar’s organic growth rate. That calculation requires appropriate comparable disclosures rather than an assumption based on the headline percentage.
Preliminary acquisition accounting is another reason to retain some flexibility when interpreting reported figures. Investors should follow subsequent filings for completed allocations and any resulting changes, rather than assume every accounting estimate is final.
Cash and valuation remain separate tests
Accounting earnings and cash generation are related but different. Customer collections, inventory purchases and the timing of payments can make cash movement differ from reported profit. The cash balance is a useful starting point, but the cash-flow statement explains more about how that balance changed.
Similarly, a stronger business quarter does not automatically make a stock inexpensive after a large rally. Investors need to consider the valuation they would be paying, the durability of earnings and the possibility that expectations have moved ahead of results.
The clearest reading of SNT’s jump is that investors received a stronger operating report and reassessed the opportunity. The next reports should help establish whether that improvement persists. Until then, maintaining a distinction between demonstrated performance, management expectations and market enthusiasm is essential.
This article is market commentary for educational purposes, not a recommendation to buy or sell a security.