
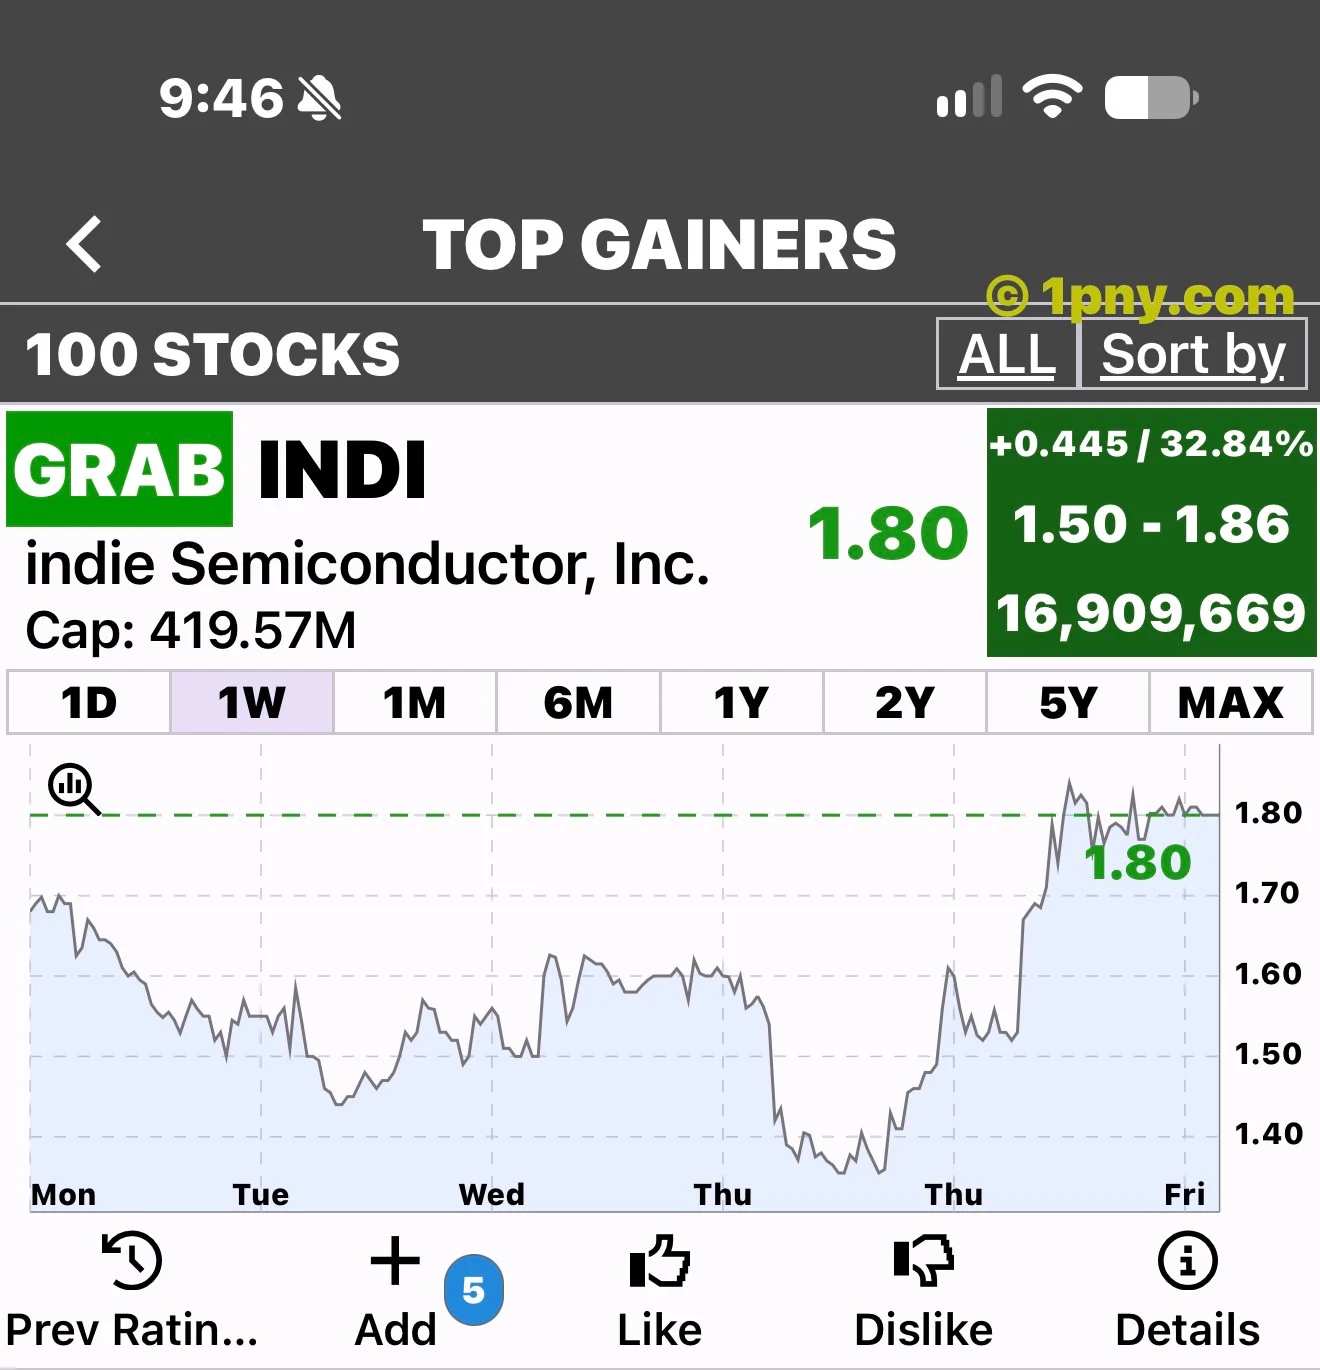
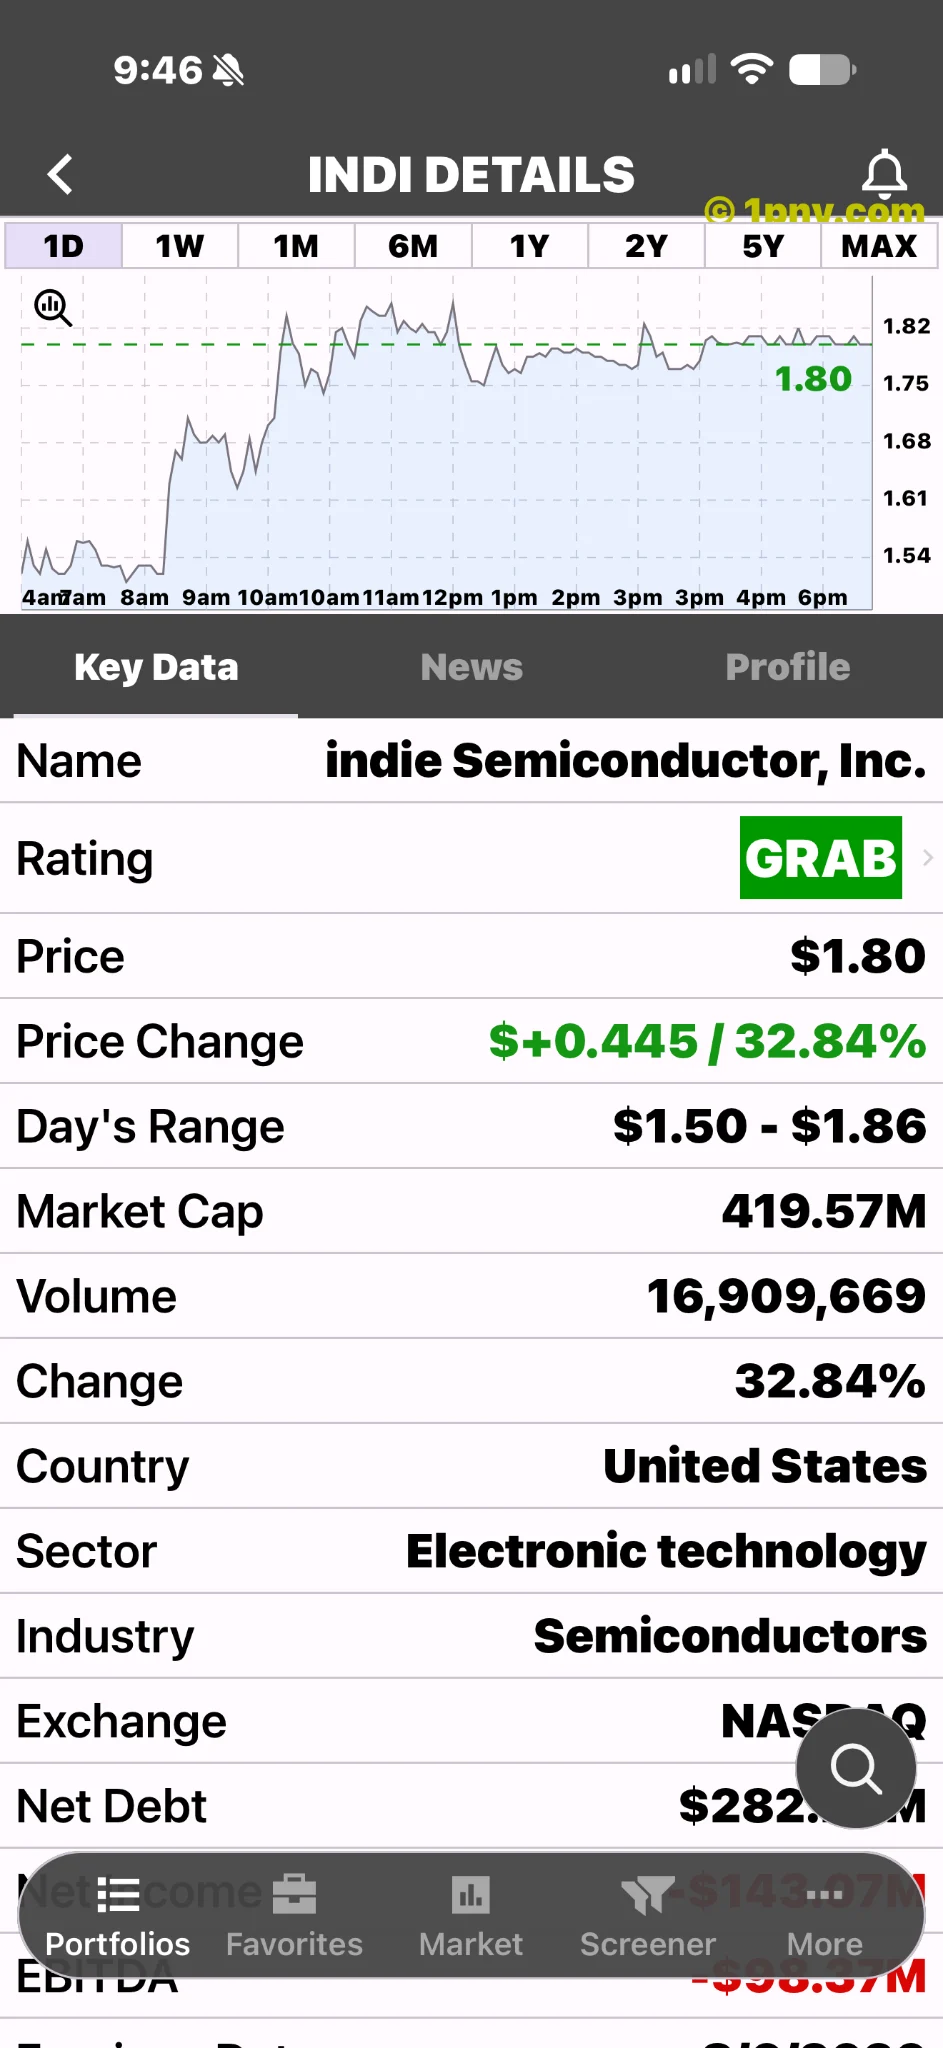
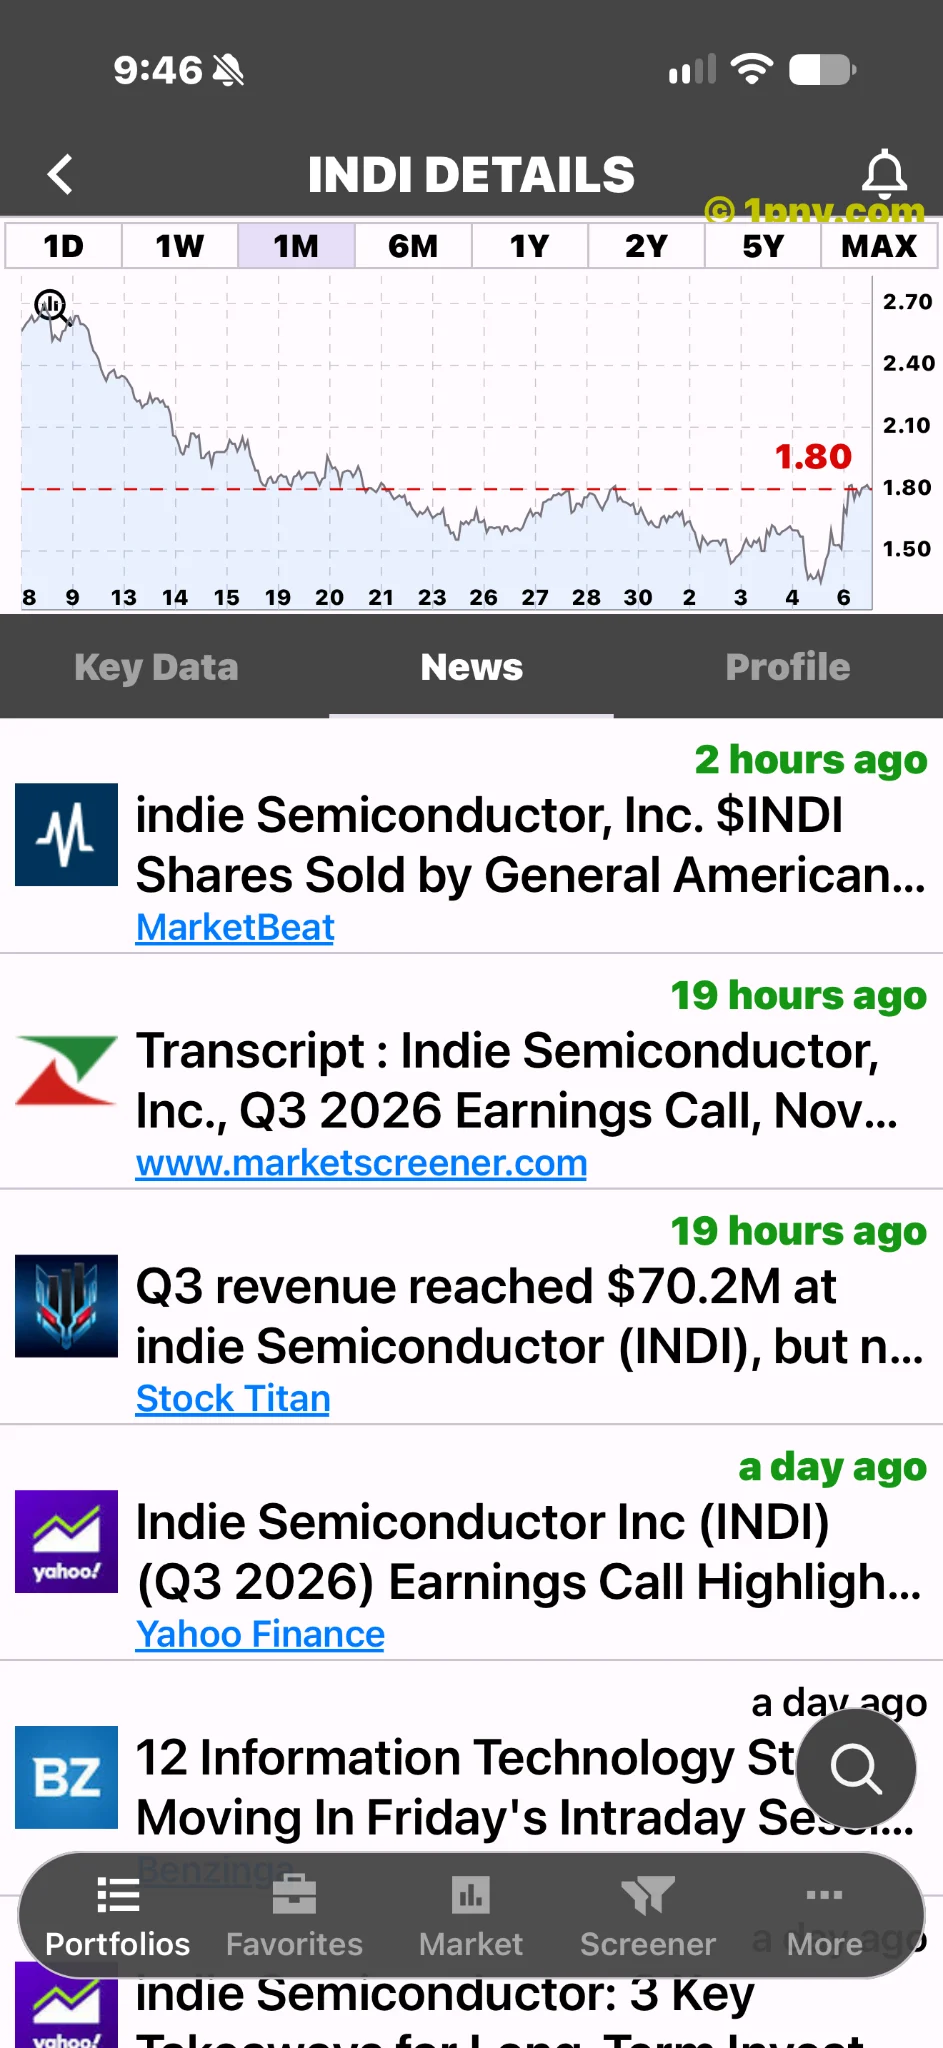
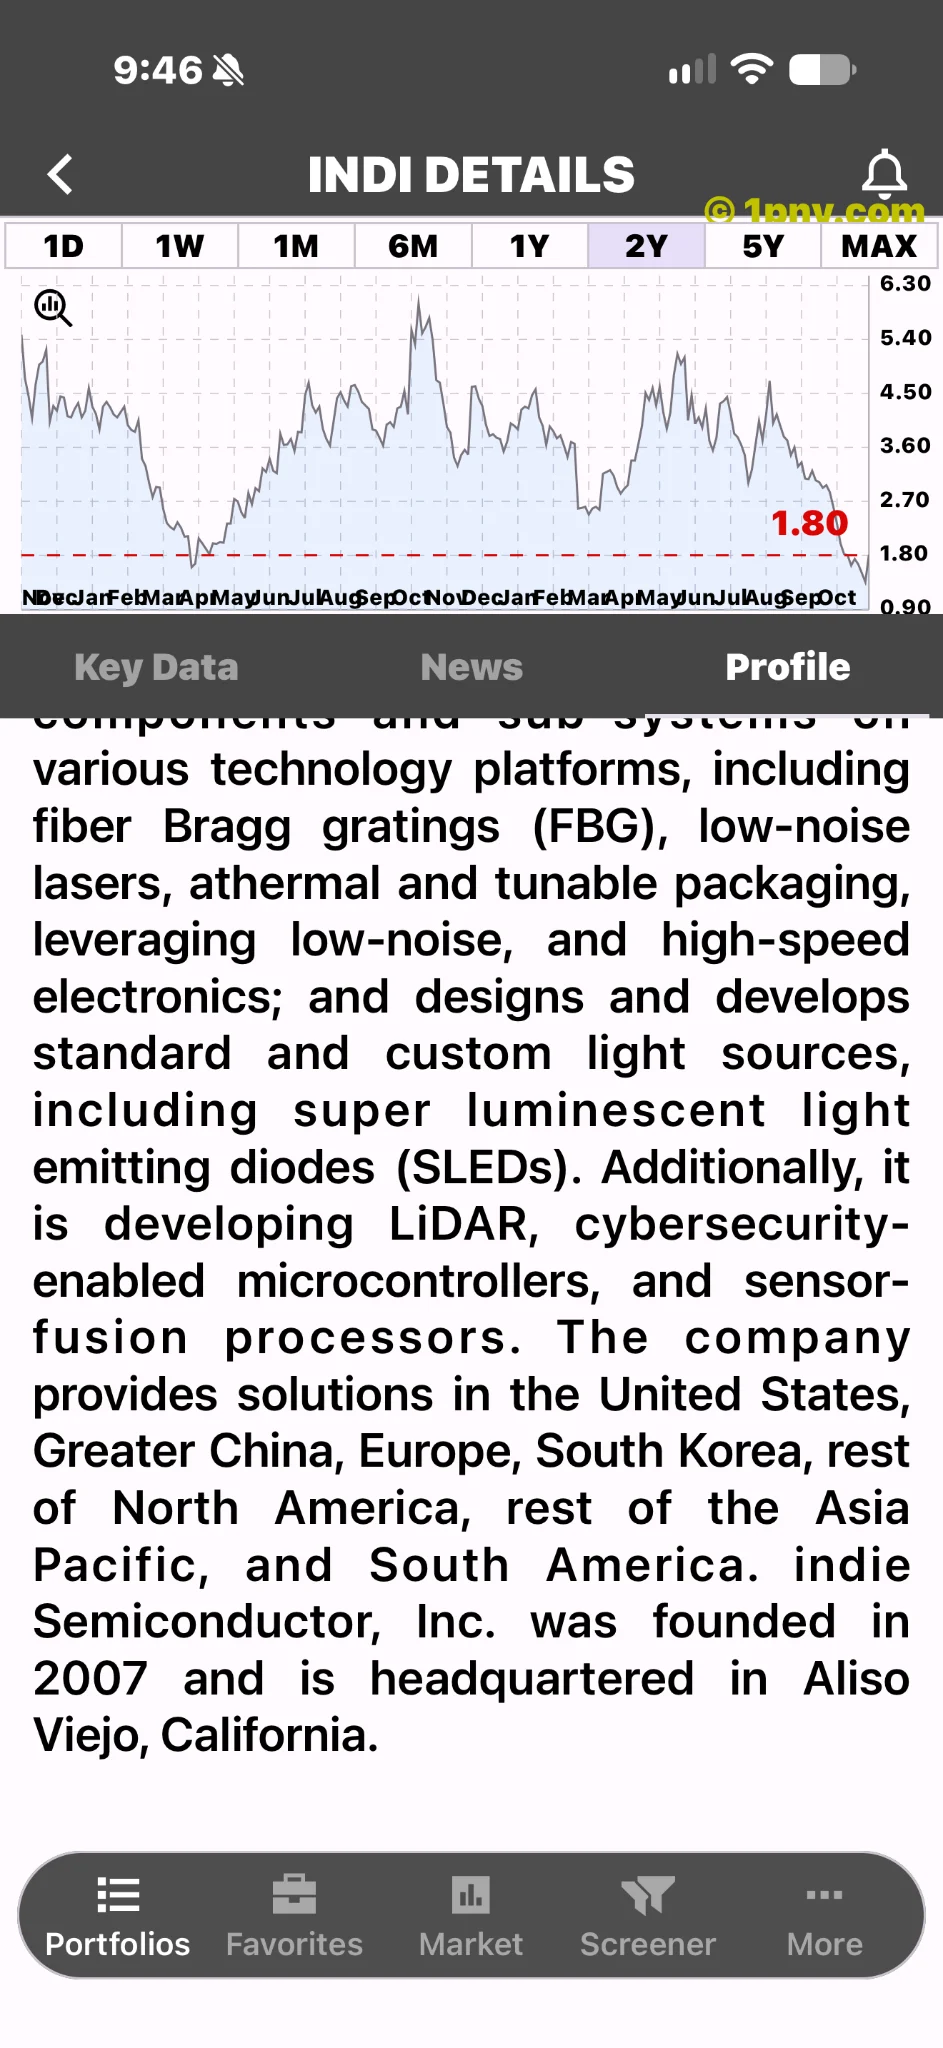
indie Semiconductor’s November 5 earnings release offered investors a combination of sales growth and a stronger outlook to assess. The following day, INDI closed at $1.81, up +33.58%, according to historical trading data. The supplied Penny Gems screenshot shows $1.80 and a +32.84% gain. Those figures describe a different market snapshot and should remain separate from the November 6 regular-session close.
The measurable developments behind the rally
Third-quarter revenue was $70.2 million, up +31%. Management forecast fourth-quarter revenue of $73 million to $81 million. The non-GAAP operating loss narrowed to $7.2 million, but the GAAP operating loss was $39 million. The company also announced a radar-chipset selection by a major North American vehicle manufacturer.
Together, these disclosures provide a plausible company-specific explanation for renewed interest. They do not demonstrate what motivated every market participant, and they do not establish that the rally fully reflects the company’s long-term value. Price changes summarize trading decisions; understanding the business still requires examining the underlying numbers.
Why the outlook matters alongside the completed quarter
An earnings report looks backward, while guidance gives investors management’s current view of what may come next. When considering a growth company, investors often need both. Strong historical sales provide evidence of activity already completed; a forecast offers a framework against which subsequent performance can be assessed.
The forecast should remain a range rather than a guaranteed result. Its midpoint is a convenient analytical reference, not a commitment that the company will deliver precisely that amount. Investors can compare the eventual outcome with the range and examine the reasons for any difference.
The composition of growth also matters. A company’s consolidated revenue may include businesses with different economics, ownership arrangements or future plans. Investors should understand the scope of the reported total before treating every dollar as equally representative of the continuing core business. Comparing like with like is more informative than simply extending a headline percentage into future years.
Two loss measures tell different stories
GAAP and non-GAAP figures serve different analytical purposes. GAAP reporting follows the applicable accounting framework. Non-GAAP reporting removes or adjusts specified items to offer an additional view of performance. Investors need to review the reconciliation to understand those choices rather than assume the adjusted measure is the more accurate one.
A narrowing adjusted loss can indicate progress on the basis management is emphasizing. It does not establish accounting profitability, nor does it eliminate expenses excluded from the adjusted calculation. Likewise, operating losses should not be confused with the exact amount of cash spent during the quarter.
A useful follow-up is to examine which costs are changing, whether those changes can persist and how cash flow compares with the earnings presentation. This creates a more grounded profitability assessment than focusing exclusively on whichever measure improved most.
A design selection needs time to prove its economics
A program selection can offer an encouraging commercial signal, but it is not enough to assign a guaranteed lifetime value. Production timing, the number of vehicles manufactured, content supplied per vehicle and the economics of delivery all affect the revenue and profit that might eventually follow.
Those are analytical questions, not additional facts disclosed here about the selected program. Investors should avoid inventing contract values or assuming immediate full-scale production from a brief announcement. Later disclosures and reported sales are better evidence of the commercial contribution.
What to watch after the price jump
The next results should help test whether the revenue outlook is achievable and whether growth brings the company closer to sustainable profitability. Investors can follow sales, margins, expenses and cash flow together rather than treating a single metric as decisive.
INDI’s rally followed measurable business developments. The more demanding question is whether those developments support durable returns at the valuation investors now face. Keeping results, forecasts and expectations distinct is essential to answering it.
This article is market commentary for educational purposes, not a recommendation to buy or sell a security.