
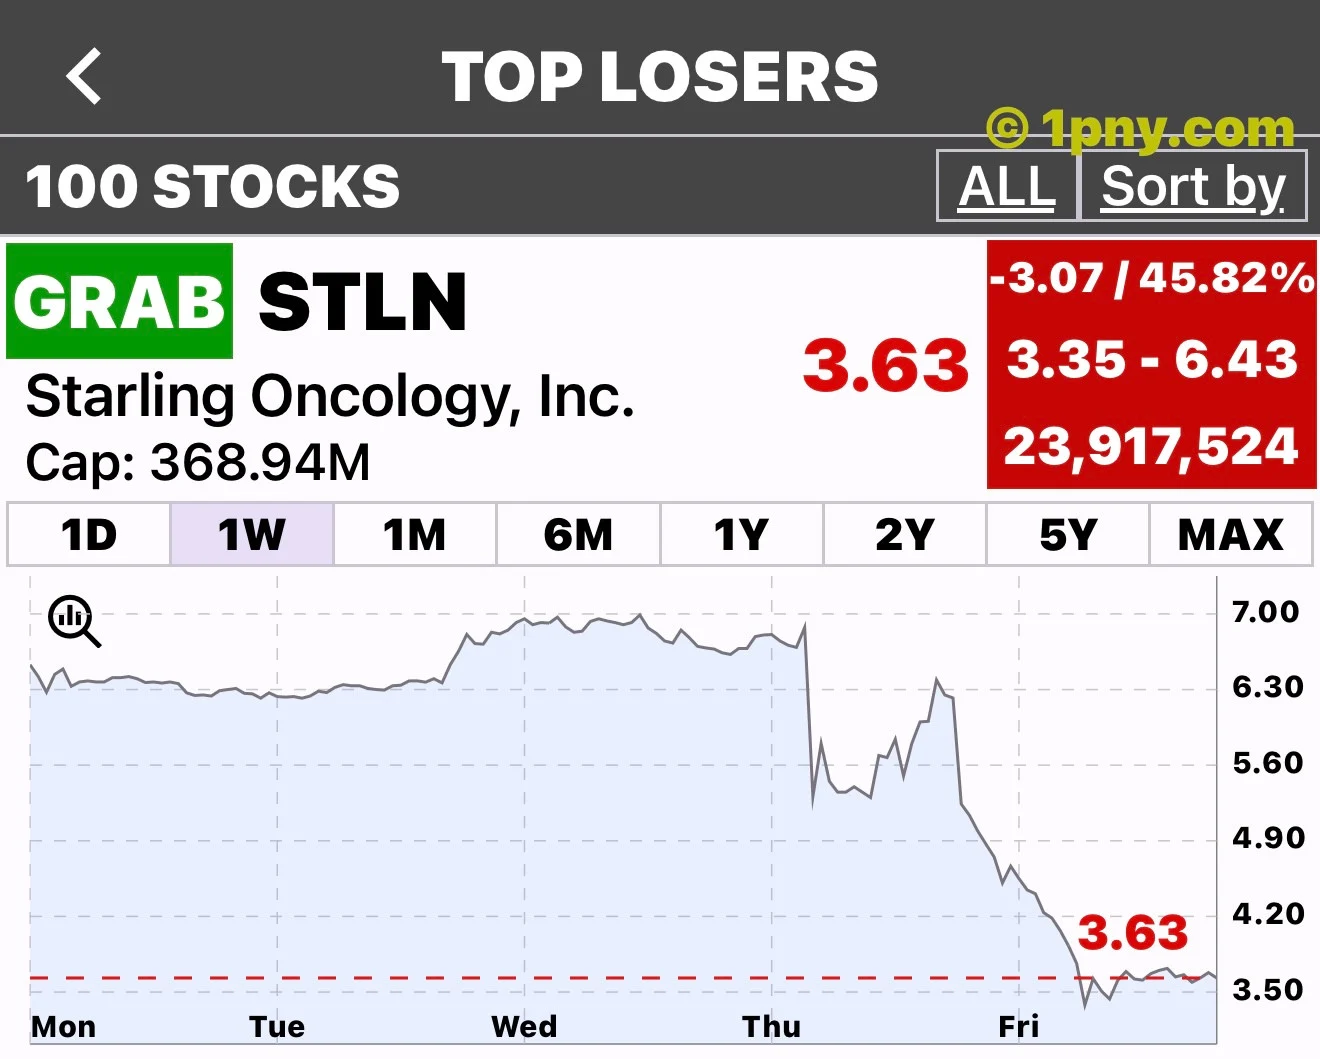
$STLN, $3.63. The supplied Penny Gems snapshot shows Starling Oncology down −45.82%. Reviewing the November 6, 2026 session, the central question is why investors marked down the stock after a quarterly update that included growth. The evidence supports a discussion of expectations and execution risk, rather than a claim that the underlying business suddenly stopped expanding.
Growth and a mixed outlook
Quarterly revenue rose +24.3% to $169.8 million. Annual revenue guidance narrowed from $650–670 million to $650–660 million; free-cash-flow guidance moved from $5–15 million to $5–10 million. Adjusted EBITDA guidance changed from $2–7 million to $4–6 million. These were mixed revisions, not an across-the-board cut. [Starling's November 5 results](https://investors.starlingoncology.com/news-releases/news-release-details/starling-oncology-reports-third-quarter-2026-financial-results)
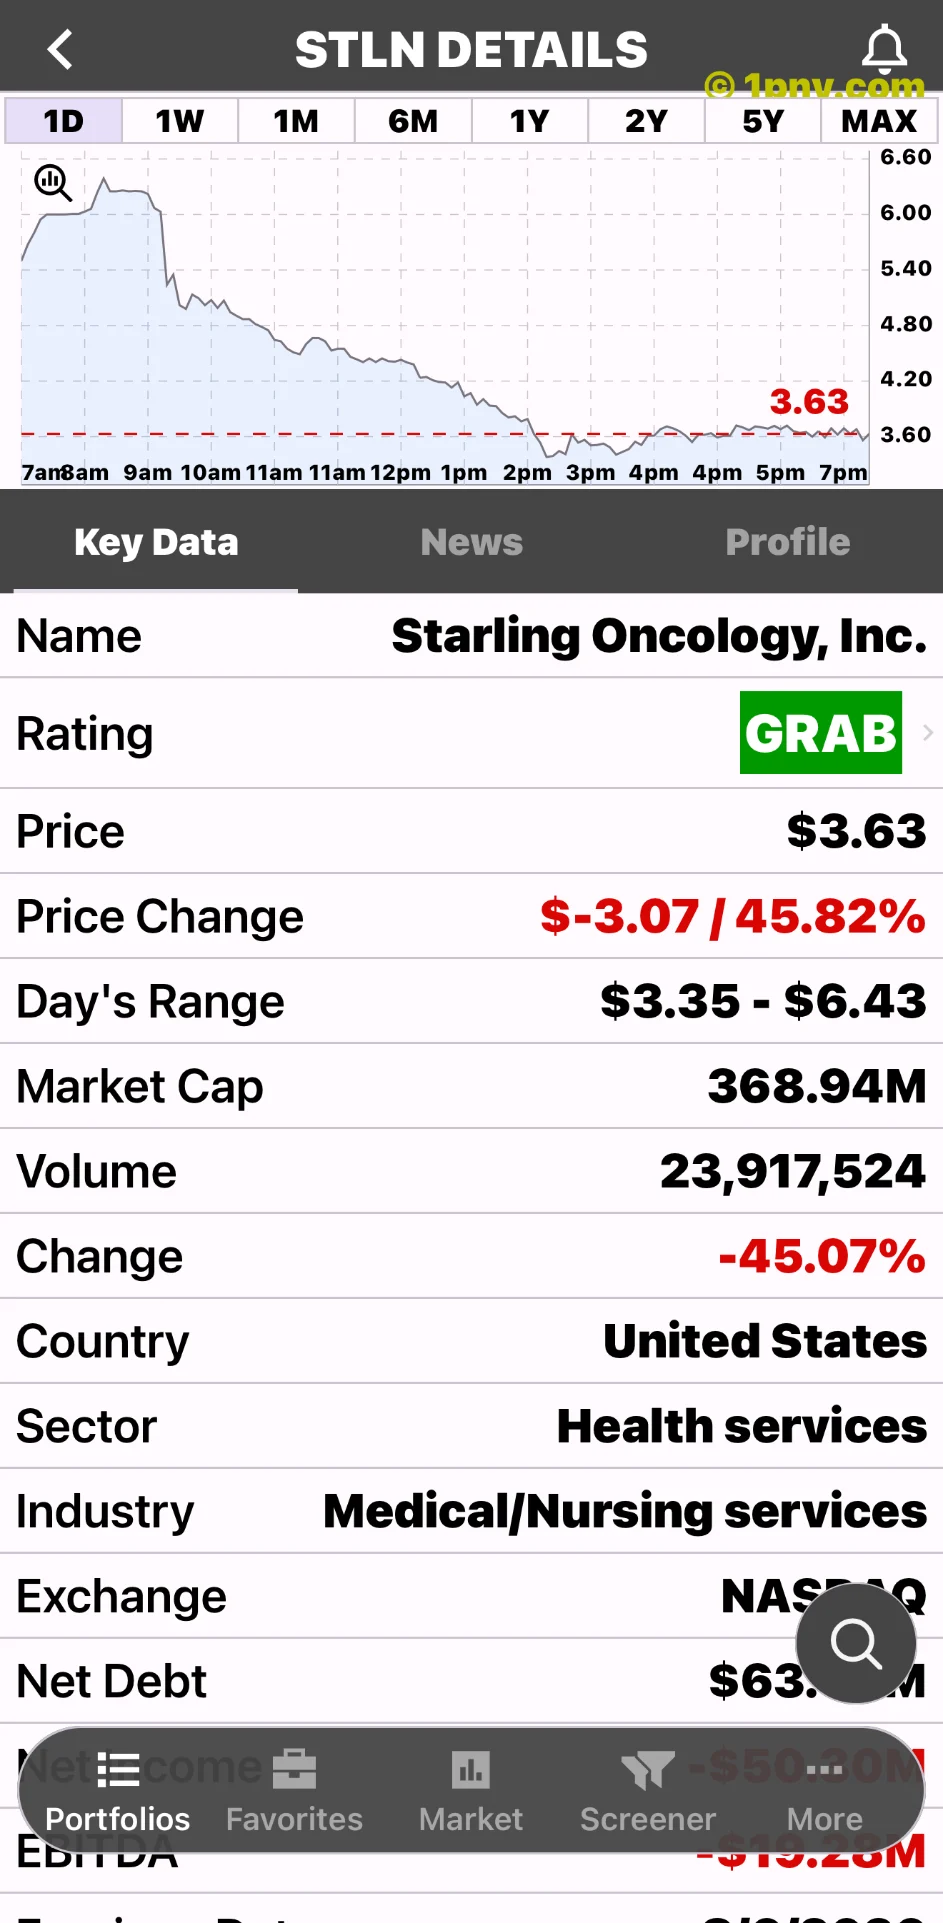
For an investor, the distinction matters. Revenue measures the scale of activity, while cash generation helps determine how much of that activity can support obligations, investment and shareholder value. A company can sell more services and still face questions about how efficiently it turns those sales into resources available to fund the next stage of growth.
The lower ceilings for two measures offer a plausible explanation for disappointment. However, the report alone cannot identify the expectations embedded in every investor's position. A full explanation of a sharp move would require evidence about positioning, market liquidity and trading decisions that is not available in these disclosures. Our assessment therefore remains a reasoned interpretation, not a proven account of every sale.
What the trading record confirms
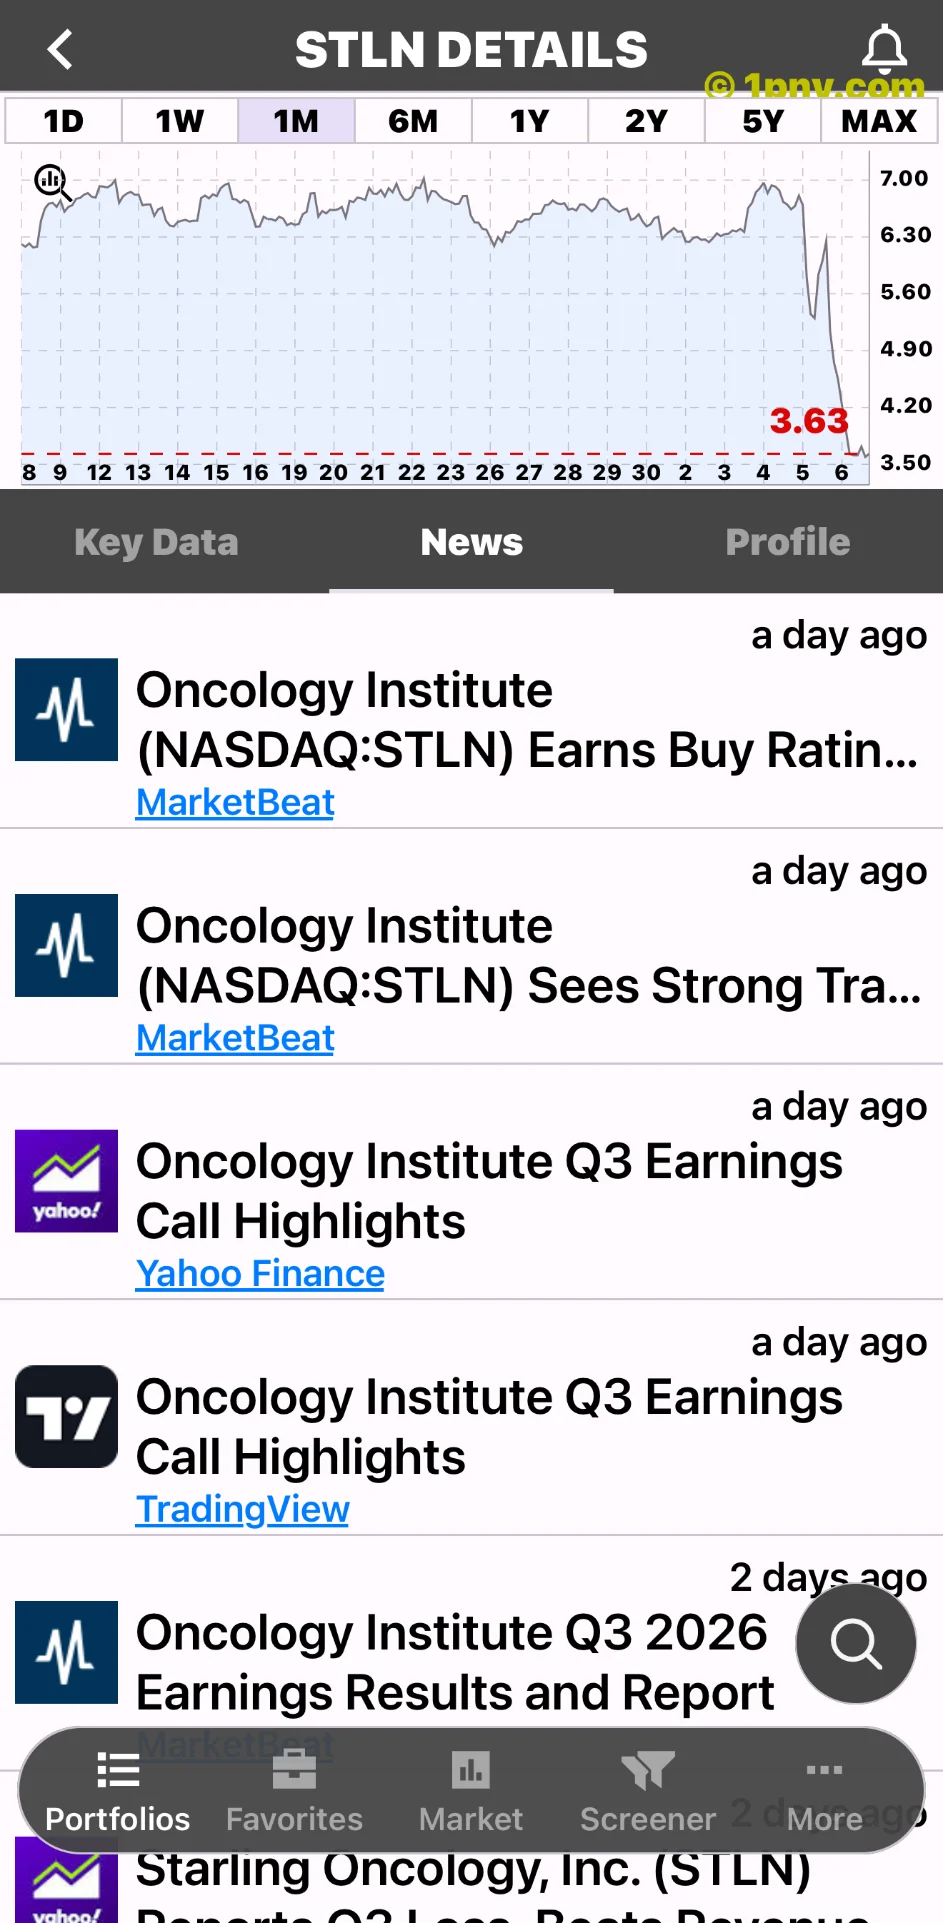
ChartExchange's historical table records a November 6 close of $3.62, down −45.97%. The closing observation provides a separate reference point for reviewing the session. [STLN price history](https://chartexchange.com/symbol/nasdaq-stln/historical/)
Price and volume data have limits as evidence about investor behavior. Volume alone does not reveal whether participants were long-term shareholders exiting, short-term traders entering, or intermediaries turning over inventory. Nor does a sharp price move prove manipulation or establish a durable bottom. Trading statistics should inform the investigation without substituting for an assessment of the business.
The supplied image and the historical table are different observations. A captured app reading can differ from an official-session calculation because of timing, rounding or the reference price used. Keeping the $3.63 screenshot separate from the $3.62 table close makes the article more informative than forcing both into a single supposedly exact quote.
How to assess the next report
The next useful test is delivery against the revised ranges. Investors can compare actual revenue with management's expectations, examine the reconciliation between adjusted measures and reported earnings, and check whether cash generation remains consistent with the operating story. An adjusted earnings improvement should be evaluated alongside the costs excluded from that measure.
A practical valuation exercise should also separate business performance from the purchase price. Even a growing business can be an unattractive investment at an excessive valuation; a falling stock can remain expensive if the cash available to owners disappoints. Neither conclusion follows automatically from a one-day chart. Updated share counts, debt and cash balances belong in that assessment.
For prospective buyers, a staged checklist is more useful than a rebound prediction: understand the revised assumptions, identify what would invalidate them, and decide how much uncertainty the price compensates for. Existing holders face the same questions without treating their original purchase price as evidence of present value.
Penny Gems' GRAB label is the app's signal, not this article's recommendation. This November 7 review is informational and does not promise a recovery.